

Updated on October 12th, 2022 by Bob Ciura
The goal of most investors is to either:
- Maximize returns given a fixed level of risk
- Minimize risk given a particularly level of desired returns
Perhaps the best metric for analyzing both risk and return is the Sharpe Ratio. With that in mind, we’ve compiled a list of the 100 stocks in the S&P 500 Index with the highest Sharpe Ratios.
You can download your free list (along with relevant financial metrics like dividend yields and price-to-earnings ratios) by clicking on the link below:
Keep reading this article to learn more about using the Sharpe Ratio to analyze publicly-traded stocks.
What Is The Sharpe Ratio?
The Sharpe ratio is the financial industry’s favorite measure of risk-adjusted returns. It tells investors whether they are being appropriately rewarded for the risks they’re assuming in their investments.
There are three components to the Sharpe Ratio calculation:
- Investment return
- Risk free rate of return
- Investment standard deviation
For most investors, a suitable Risk-free rate of return is the current yield on 10-year U.S. government bonds. For this article, we have used a risk free rate of 0, as interest rates have declined significantly.
For our purposes here, the Investment return can be either a historical return or an expected annual return. It is expressed using a decimal; for example, 0.51 would represent a 51% return. (Note: We use 252 instead of 365 – the number of days in a year – for a one-year period because there are approximately 252 trading days in an average calendar year, or we may employ 757 or a slight variant of that for a specific three-year period).
We employ the calculated Investment standard deviation, usually based on daily variations, to take into account periodic fluctuations in the investment due to such things as dividends and stock splits. Determination of the Sharpe ration thus can require a large number of repetitive calculations. This can be done easily and conveniently via a Microsoft Excel spreadsheet, as will be demonstrated later.
The Sharpe ratio is calculated with the following formula:

The risk free rate of return can be different depending on your use case. For risk-free rate of return = 0, the equation for the Sharpe ratio reduces to:
 Examination of this simplified equation reveals the meaning of the Sharpe ratio. It display the Investment Return as a comparative function of the Investment Risk, or the amount of principal involved.
As you might imagine, numerous complex variants of this simplified formula have been developed and used for a variety of investment purposes.
Here, we are primarily interested in a maximum return with minimal associated risk. This can be indicated by values that are larger or smaller, or by figures that are either positive or negative.
Such numbers must be viewed with the benefit of considerable investor judgment; they are not meant to be taken absolutely.
How To Use The Sharpe Ratios List To Find Compelling Investment Ideas
Having an Excel document with the 100 highest Sharpe Ratios in the S&P 500 can be extremely useful.
The resource becomes even more powerful when combined with a rudimentary knowledge of how to use the filter function of Microsoft Excel to find investment ideas.
With that in mind, this section will show you step-by-step how to implement a particular investing screen using the Sharpe Ratio stocks list. More specifically, we’ll show you how to screen for stocks with Sharpe Ratios above 1 and price-to-earnings ratios below 15.
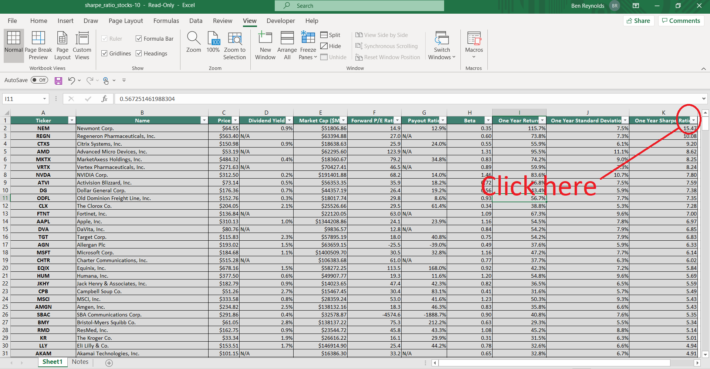
Step 1: Download the Sharpe Ratio Stocks List by clicking here.
Step 2: Click the filter icon at the top of the Sharpe Ratio column, as shown below.
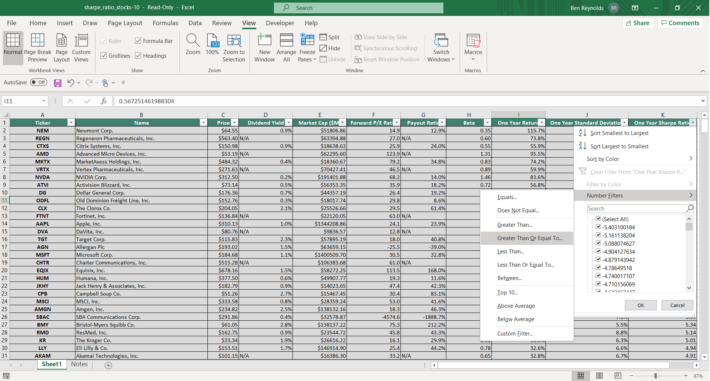
Step 3: Change the filter setting to “Greater Than Or Equal To”, input “1”, and click “OK”. This filters for S&P 500 stocks with Sharpe Ratios greater than or equal to 1.
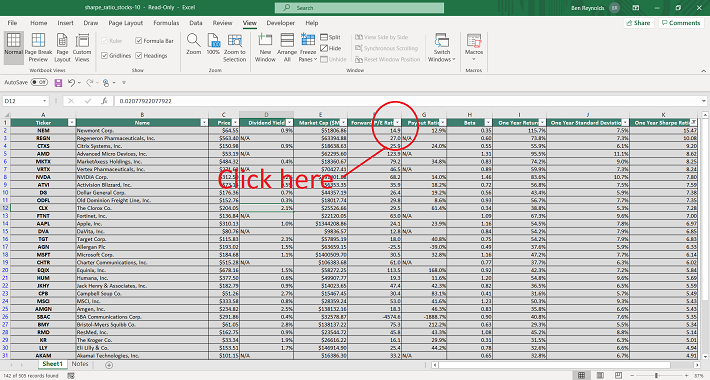
Step 4: Then, click the filter icon at the top of the P/E Ratio column, as shown below.
Step 5: Change the filter setting to “Less Than Or Equal To”, input “15”, and click “OK”. This filters for S&P 500 stocks with P/E ratios less than or equal to 15.
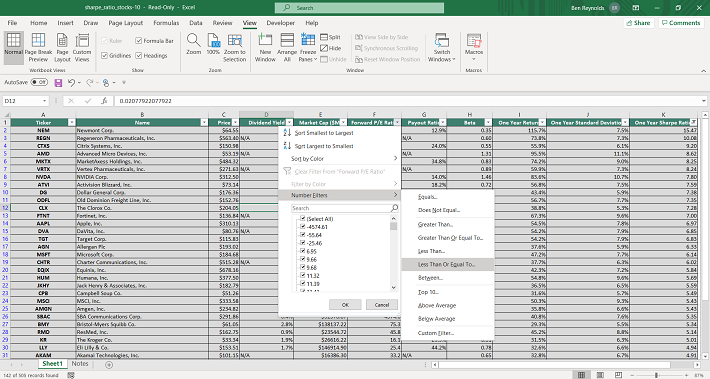
The remaining stocks in this Excel document are S&P 500 stocks with Sharpe Ratios higher than 1 and price-to-earnings ratios less than 15.
You now have a solid fundamental understanding of how to use the Sharpe Ratios list to find investment ideas.
The remainder of this article will provide more information on how to analyze stocks using the Sharpe Ratio.
How To Manually Calculate Sharpe Ratios Using Yahoo! Finance
At Sure Dividend, we use YCharts for much of our data analytics. YCharts requires a paid subscription that many of our readers do not have. Accordingly, we want to show you how to manually calculate Sharpe Ratio for publicly-traded stocks over a given time period.
More specifically, this tutorial will show you how to calculate a 3-year Sharpe ratio for Apple, Inc (AAPL).
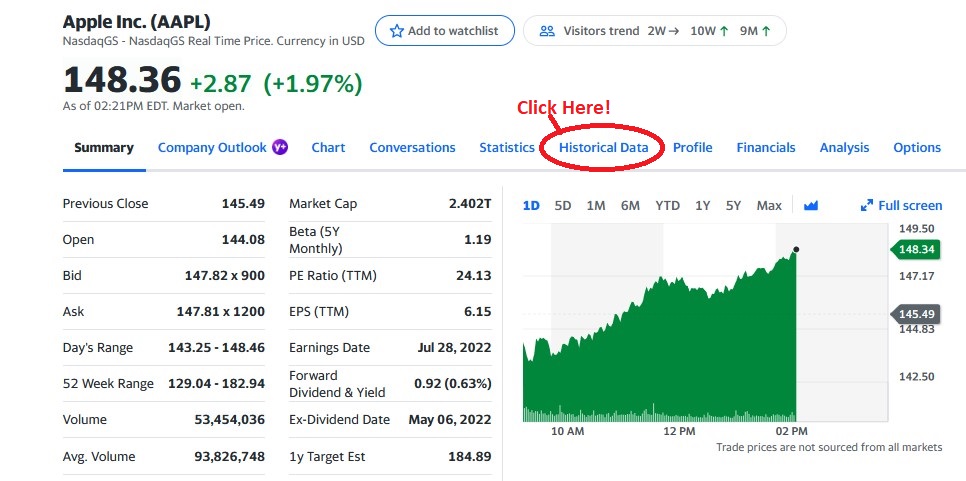
Step 1: Navigate to Yahoo! Finance. Type the ticker of your desired stock into the search bar at the top of the Yahoo! Finance bar. In our case, it’s AAPL for Apple Inc. (AAPL).
Step 2: Click on historical data, as shown below.
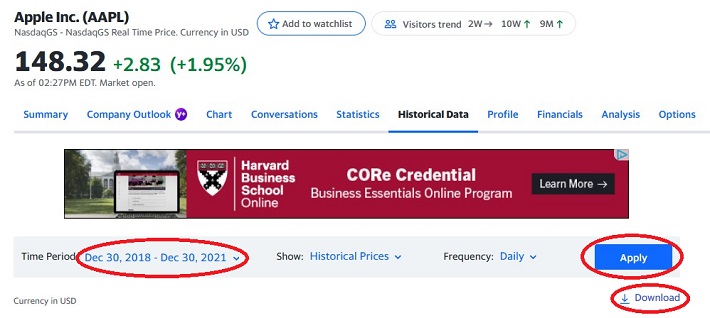
Step 3: Change the dates to get 3 years of data, and then click “Apply.” After that, click “Download” (which is just below the Apply button).
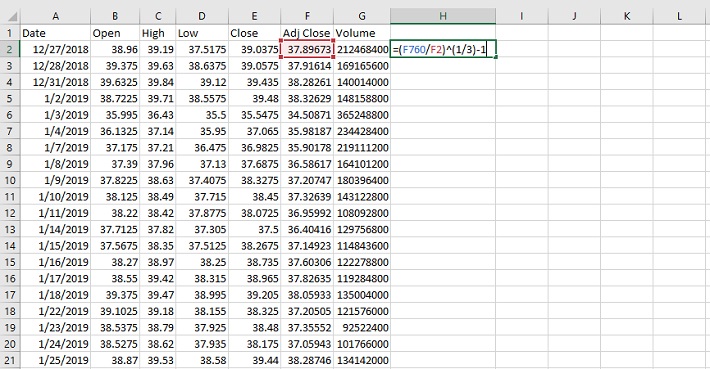
Step 4: The Excel document that will download as a result of your process so far will have six columns: Open, High, Low, Close, Adjusted Close (or “Adj Close” in the top row of the spreadsheet), and Volume. It’s Adjusted Close that we’re interested in, as this accounts for stock splits and dividend payments.
Using the adjusted close column, calculate the stock’s annualized returns during the time period under investigation.
In the example shown below, this is done by dividing the current price by the oldest price and then raising this to the inverse power of the number of years during the sample (3 in this case). The equation is shown below.
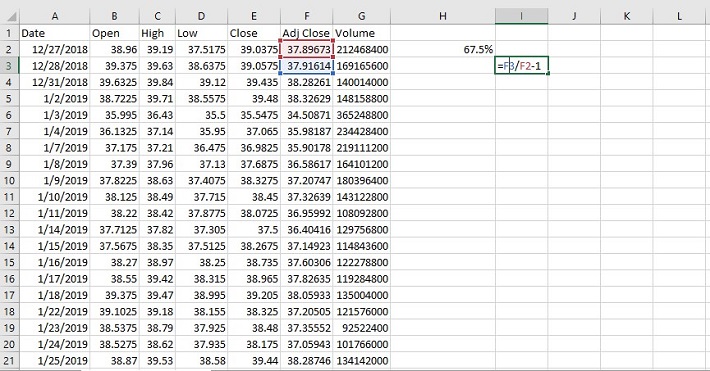
Step 5: Next, a time series of daily returns needs to be calculated. This is done in column I in the spreadsheet shown below. Do this by dividing “new day” adj. close price by “old day” adj. close price, as shown in the example below. Then drag or copy/paste the formula down to all cells.
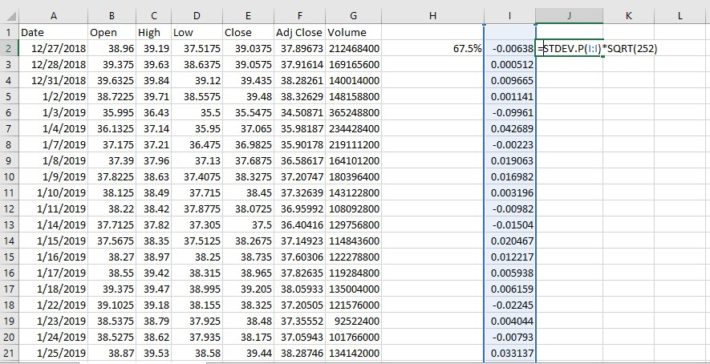
Step 6: Calculate the standard deviation of daily price returns using the STDEV.P() function, and then convert this number to an annualized figure by multiplying by the square root of 252. We use 252 instead of 365 (the number of days in a year) because there are approximately 252 trading days in an average calendar year. The formula to calculate the annualized standard deviation figure is shown below.
Step 7: Use the annualized return and annualized standard deviation data to calculate a Sharpe ratio. An example of how to do this is shown below, using 0% as the risk free rate of return.
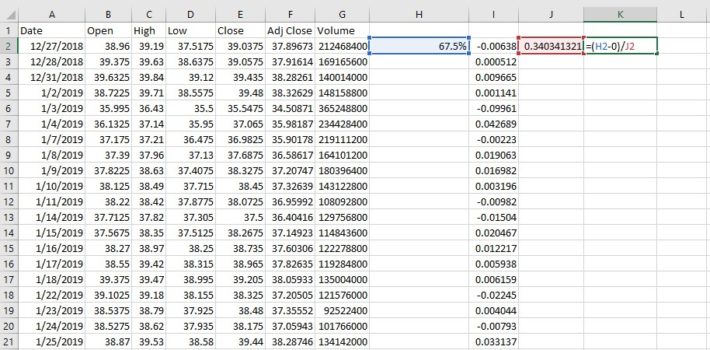
The resulting number is the Sharpe ratio of the investment in question. In this case, Apple had a 3-year Sharpe ratio of 1.98 from when the example images were created.
Final Thoughts
Looking for stocks with strong historical Sharpe ratios is a useful way to find investment ideas.
With that said, this strategy is not the only way to find high-quality investments. To conclude this article, we’ll provide additional resources that you can use for your investment due diligence.
If you are looking for high-quality dividend growth stocks suitable for long-term investment, the following databases will be useful:
You may also be looking for appealing stocks from a certain stock market sector to ensure appropriate diversification within your portfolio. If that is the case, you will find the following resources useful:
You may also wish to consider other investments within the major market indices. Our downloadable list of small-cap U.S. stocks can be accessed below:
Thanks for reading this article. Please send any feedback, corrections, or questions to [email protected].


