

cemagraphics
The S&P 500 (SPY) reached the 5000 milestone this week. I actually thought it might fall just short and in last weekend’s article speculated sentiment was getting “too bullish” just as seasonality shifted negative. Clearly, this wasn’t the case and the bullish technicals trumped my speculation.
I still think we could get a correction in February, but perhaps I am overthinking things. There have been 14 higher weekly closes out of the last 15 which hasn’t happened for 52 years. If you add the fact the S&P 500 has gained 20% in those 15 weeks, it is the first time this has ever happened. This is an unusual environment and no-one can say how “crazy” things will get.
This week I will once again identify key spots where the S&P 500 should hold on dips if the uptrend is to remain strong or roll over into a reversal. Rather than speculate on tops we can shift neutral/bearish when there is real technical evidence to do so. Various techniques will be applied to multiple timeframes in a top-down process which also considers the major market drivers. The aim is to provide an actionable guide with directional bias, important levels, and expectations for future price action.
S&P 500 Monthly
The February bar has moved far enough for a return below the January 4931 high to be considered a red flag. Dropping below 4853-61 would signal a proper bearish shift.
As mentioned last week, seasonality in February shifts weaker and the S&P 500 has closed higher only 50% of the time when it gains more than 10% in November and December and also closes higher in January. Furthermore, the second half of February is the one of the weakest two-week periods of the year.
SPX Monthly (Tradingview)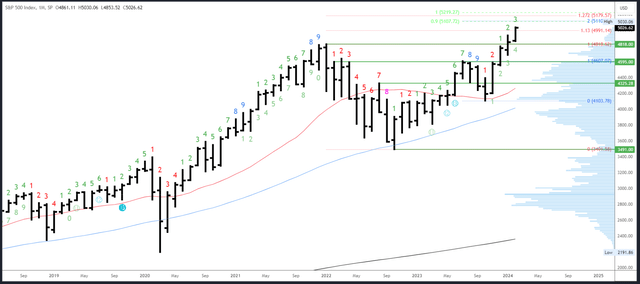
Now that the S&P 500 is in “blue sky” at new all-time highs, Fibonacci extensions and measured moves act as a guide for targets. After nearly fifteen years of drawing Fibs, I have found some work much better than others. The 1.13% extension at 4991, for example, is not something I put much faith in. However, the 200% extension of the July-October correction in confluence with the 90% measured move (90% is a measurement I use a lot in Elliott Wave) could be more significant. This comes in at 5107-5110.
As mentioned earlier, 4853-61 is an important level on the downside. 4818 is the next major level at the previous all-time high.
There will be a long wait for the next monthly Demark signal. February is bar 3 (of a possible 9) in a new upside exhaustion count.
S&P 500 Weekly
For the fifth week in a row, a strong weekly bar formed with a higher low, higher high and higher close. Follow through is again likely in the first half of next week.
The rally has now reached the top of the channel at 5025. There may be a reaction at some point next week and we can watch closely for a change in character. Once more, a key change would be new lows of the week on Thursday and Friday instead of the new highs we keep seeing recently.
SPX Weekly (Tradingview)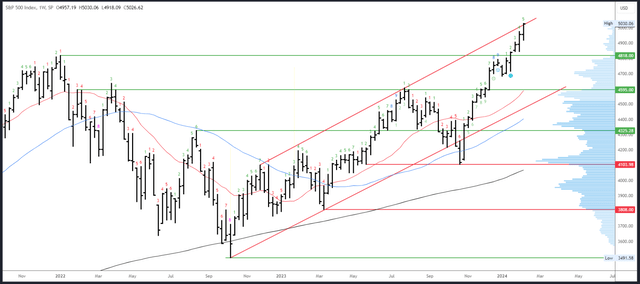
Channel resistance is around 5025. The same Fib targets from the monthly chart apply so 5107-5110 is the next target.
There isn’t any major weekly support close by, with the small weekly gap from 4842-44 the first important area.
An upside Demark exhaustion count will be on bar 6 (of 9) next week so no exhaustion signal will register. A reaction is usually seen on weeks 8 or 9.
S&P 500 Daily
Friday’s strong session broke the 5000 level convincingly and closed right at the highs. This move should continue, at least in the early part of next week, and 5000 is now near-term support.
The rally has reached the top of the daily channel from the January low as well as the large weekly channel. So far, every time it has touched the channel high it has pulled back slightly or paused. Breaking a previous day’s would be a change worth noting.
SPX Daily (Tradingview)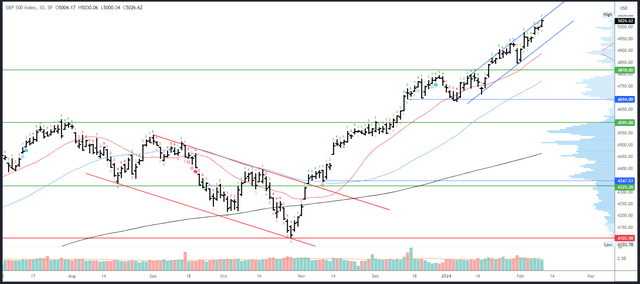
Apart from the dual channels at 5025, there is no resistance.
5000 is the first support, but not relevant to the health of the trend. 4975 is more important and a break through this level would take some of the most bullish options off the table (but would yet not confirm a top is in). Channel support is around 4930 on Monday and rising 10 points per session.
An upside Demark exhaustion count will be on bar 8 (of a possible 9) on Monday which means we may see a reaction on Monday or Tuesday.
Drivers/Events
This week was particularly quiet. Fed speakers said nothing new, data was in-line and bond auctions were unremarkable. CPI revisions on Friday balanced out with no significant changes.
Next week should bring more action as CPI is released on Tuesday. The big question is whether the tick up in economic data over recent months will be reflected in inflation readings. The next big question is whether it really matters to the S&P 500. After all, the recent trend of higher yields and lowering odds of Fed easing haven’t dented the rally at all. I do think these things still matter, but it might need some kind of jolt to get the market to listen.
Retail Sales, Empire State Manufacturing and Unemployment Claims will be released on Thursday.
PPI and Consumer Sentiment are released on Friday.
Probable Moves Next Week(s)
The S&P 500 blew through 5000 and closed the week strongly. Friday’s action provides good odds for a further high above 5030 early next week.
That said, the rally has run into some resistance at the top of the weekly and the daily channels. With a daily exhaustion signal due to come into effect on Monday or Tuesday, there are reasons to believe a new high above 5030 fails.
How any failure plays out will be important for the rest of the week and potentially the entire trend. Recent dips and corrections have been minimal. Often all we see is a daily “inside bar” before continuation higher. In the most bullish scenarios, the 5000 level should hold.
Bears could get some traction with a break through 5000, and more importantly 4975. Most important of all, look for new weekly lows on Thursday and Friday and a close at the low of the weekly range. This would be a change in character and provide some much needed evidence to support speculative top calls.

")


")


")