

JasonDoiy
When the story is well known, the crowd can still be right for some time. But eventually, the late buyers suffer from really poor returns. The extent of those returns of course depends on how far from reality things actually got. For Rexford Industrial Realty, Inc. (NYSE:REXR) things got fairly silly in 2022.
At 35x 2022 FFO, we now rate this as a sell. We are rapidly reaching a point where the growth rates are likely to disappoint and investors should hit the exit before that. While we don’t deny the quality here, the numbers just don’t make sense at this stage of the cycle.
– Source
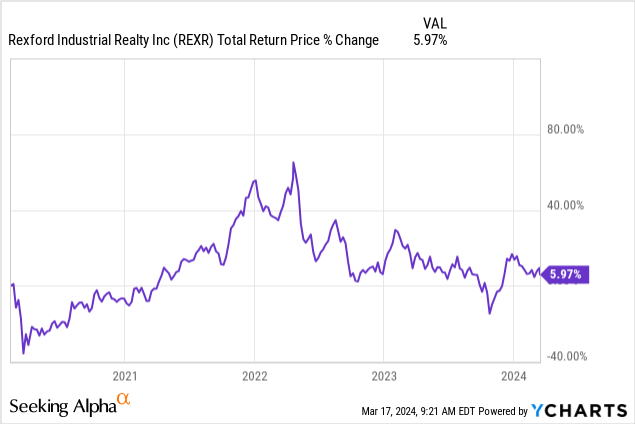
If you look at the returns from there, they are not particularly bad.
Seeking Alpha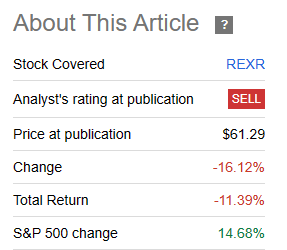
But they have remarkably compressed your annualized returns. If you bought it just before the pandemic, your total returns over the past 4 years are just 5.97%. Not 5.97% annualized, just 5.97%.
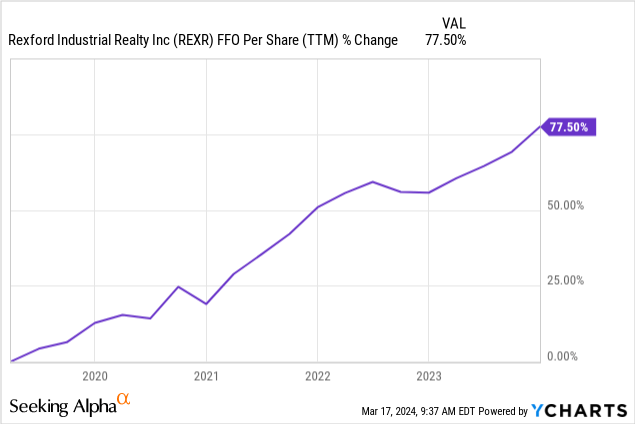
The magic of all of this is that it happened even as funds from operations (FFO) did basically what the bulls predicted.
Well, that was the pain trade so far. We now look at the recent results and tell you why this is not going to get any better for you, any time soon.
Q4-2023
Q4-2023 was a solid quarter with FFO coming in at 56 cents a share. This was a 14% increase over the previous year. But there were some issues that were creeping into the mix. These were not easy to spot if you just bought the growth-focused presentation the company put out. But you could see it if you focused on the rate of change of growth. Q4-2023, for example, was full of high double-digit leasing spreads.
REXR Financials Q4-2023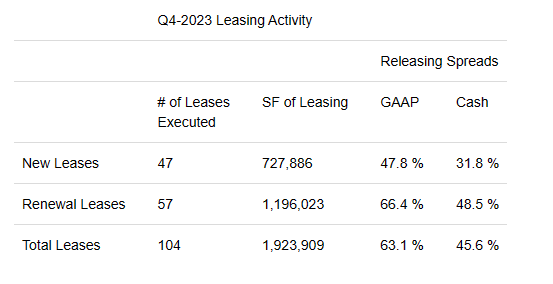
Management continues to highlight how amazing these leasing spreads are and we generally agree with them. But have a look at the annual rate which captures the 2023 year.
REXR Financials Q4-2023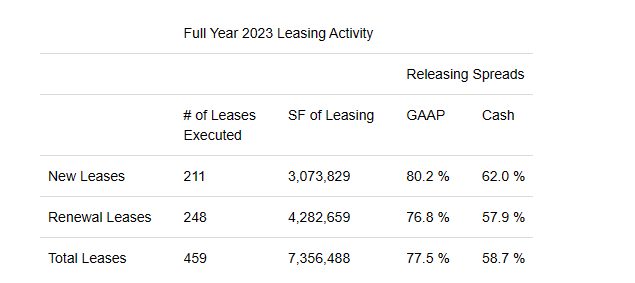
Notice how these numbers are way ahead of what you saw in Q4-2023? Of course, investors might go with “So what, who is going to complain about a 31.8% cash increase on new leases?”. Well the answer to that, is those same investors eventually.
The REXR story of “mark to market” has been well-known for the last 4 years. Outside the “Nigerian Astronaut” allegedly stuck on the moon, everyone knew this growth would take place. So the problem is when that growth rate disappoints and it is beginning to disappoint. This was not just confined to the 2023 leasing spreads. 2024 looks pretty underwhelming too. This slide below has a lot of goodies for newbie investors and we would draw your attention to how little the FFO per share moves from the investments made in 2023.
REXR Presentation Q4-2023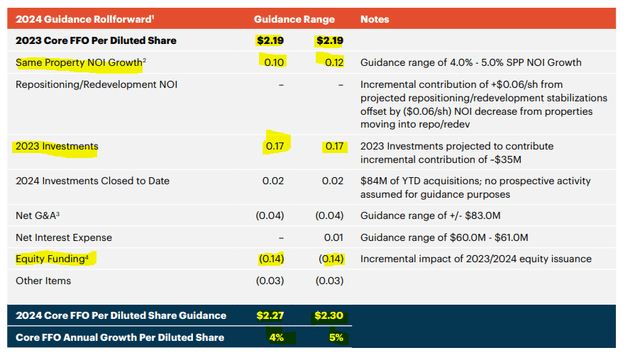
If you heard the bullhorn for the last year, it was all about how REXR was making great investments. Even REXR is proud of what they have done.
REXR Presentation Q4-2023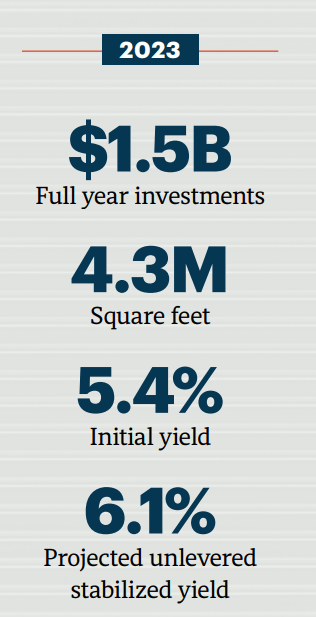
But if you go back here, you see that all of that contributed 3 cents a share net (17 minus 14). If you assume some of the G&A increase was attributable to this massive size increase, your net contribution drops to almost zero.
REXR Presentation Q4-2023
JPMorgan downgraded the shares as even they were surprised at how little mileage the company was getting from the tightest industrial market. Tightest yes. But nowhere near as tight as it was two years back. We have marked the approximate point at which the stock peaked as well, which was just after vacancy started rising.
REXR Presentation Q4-2023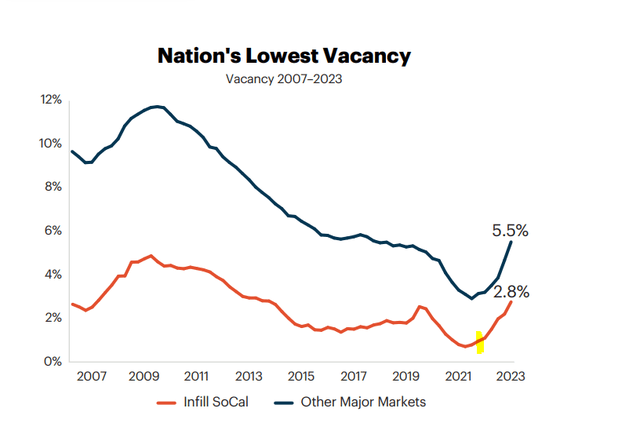
Of course, everyone still believes that So-Cal (Southern California) has a low risk of oversupply.
REXR Presentation Q4-2023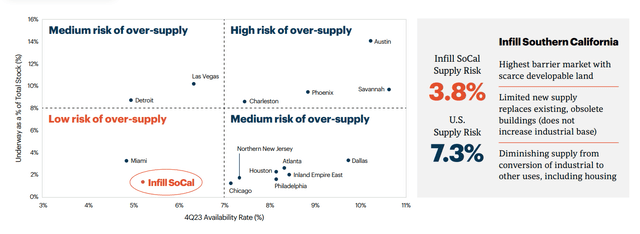
Of course that might be true and even we have had a hard time finding a bear case on this one.
When all the experts and forecasts agree – something else is going to happen.
– Source
We certainly saw this in the multifamily housing situation. You could not find anything negative about Sunbelt investing in 2021 or early 2022.
Tennessean Jan 2022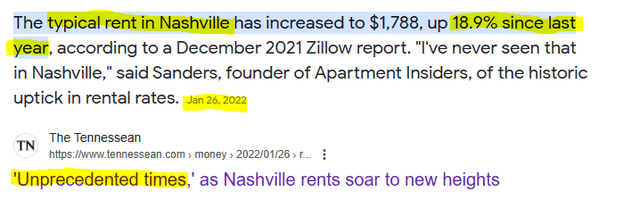
Fast forward to today and the historic supply hitting the markets has turned rent growth in the tightest markets of 2021, negative. We are back to “precedented”.
Co-Star Group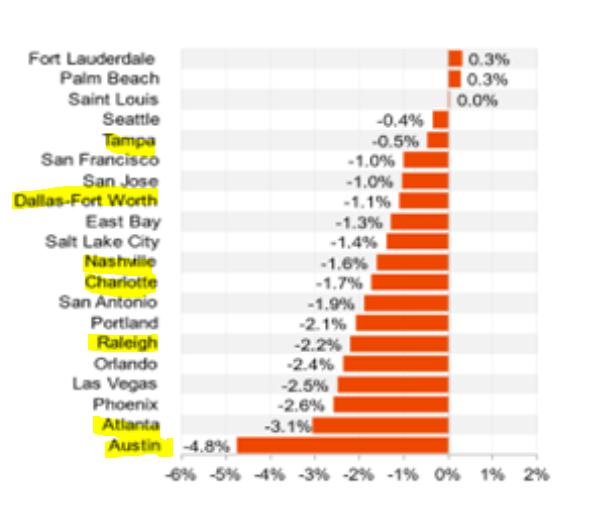
So if we see such a hit for REXR, the results will be pretty epic. This will be the case even if we hit it two years from now, as the REIT is nowhere near a reasonable valuation.
Seeking Alpha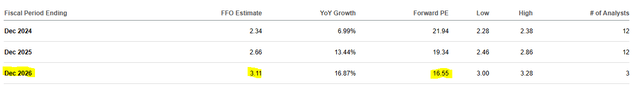
Verdict
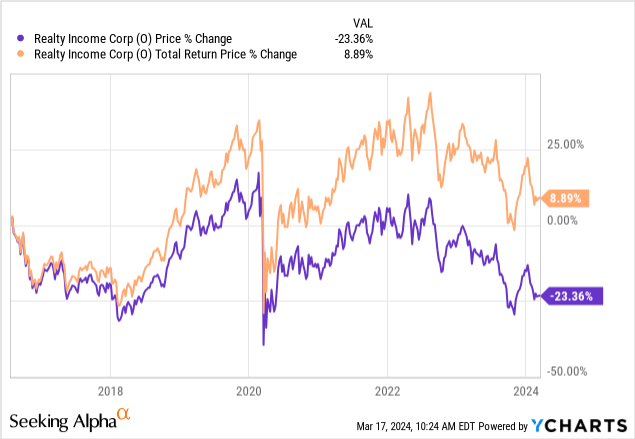
The small rumblings in the economic landscape for REXR should not be ignored. Rich valuations have a few things that you can be certain about. In the short term, they can get richer. In the long run, they almost always revert to an extreme undervaluation level. If you overpay, well then, you really overpay. Here is Realty Income’s (O) chart from its silly 2016 multiple. FFO grew, dividends came in and you still managed 8% total returns over 8 years. But hey, at least they give it to you monthly.
For REXR such a valuation compression could mean that the pain might still be ahead. If you slap a 14X FFO on 2025 numbers, you will likely breach the recent lows. Our previous trade route of selling covered calls after big drawdowns remains the better way of navigating this. At present, we would wait for the stock to approach $45, before initiating a new trade along these lines.
Rexford Industrial Realty, Inc. 5.625% CUM PFD C (NYSE:REXR.PR.C) & Rexford Industrial Realty, Inc. 5.875% PFD SER B (NYSE:REXR.PR.B)
While we have not been fans of the common shares, the REXR balance sheet is about as close to “fortress” as it gets. We have seen that term thrown around pretty loosely and even attributed to REITs like Ventas (VTR) which are now carrying 7X debt to EBITDA levels. But this is what a real fortress looks like.
REXR Presentation Q4-2023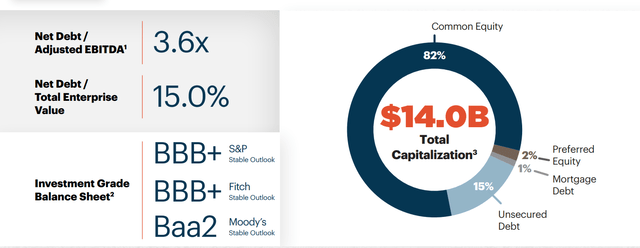
The preferred shares have been excellent investments if you can get them at the right price. We picked up REXR.PR.C on October 6, 2023, when it was at $19.83 and then sold out in December near $22.00. At present they are sort of middling with 6.5% yields. We would get interested again if we saw them yield over 7%.

")


 Q2 2024 Earnings Call Transcript")


