

tadamichi
Introduction
The iShares Russell 1000 Growth ETF (NYSEARCA:IWF) is a two-decade-old product that has been covering large-and-mid-cap stocks that exhibit growth characteristics. To elaborate, this portfolio focuses on the growth component of the Russell 1000 index (the largest stocks of the Russell 3000 index which is the benchmark for the entire US stock market), and in aggregate, stocks that comprise IWF account for 51% of the former (by market value). Currently, IWF covers close to 450 stocks, with a relatively higher threshold of P/BV valuations, a higher forward medium-term growth trajectory, and a higher sales-per-share track record, vis-à-vis other stocks that comprise the Russell 1000 Index.
What Are Some Of IWF’s Standout Characteristics?
In order to get a better grip on IWF’s qualities, we’ve juxtaposed it against another notable large-cap growth product – the SPDR Portfolio S&P 500 Growth ETF (SPYG), which also interestingly came to the bourses in the same year as our focus ETF (2000). As the name suggests, SPYG is a lot narrower in scope, focusing on just the growth stocks that comprise the S&P 500 (227 stocks in total).
Given this relatively smaller pool of stocks, SPYG is prone to a lot more churn on an annual basis; typically 1 in every 3 stocks gets churned out of SPYG’s portfolio, as opposed to a much lower annual turnover rate of just 14% for IWF.
Whilst investors may appreciate IWF’s relative stability, they may be put off by the relative cost inefficiency and the underwhelming income angle. Note that IWF’s expense ratio of 0.19% is almost 5x larger than SPYG’s corresponding ratio.
In recent years, IWF also hasn’t been growing its dividends at a particularly impressive pace, relative to SPYG (3-year CAGR of 20% vs 29% for SPYG). As a result, the yield variance between IWF and SPYG has widened by over 40bps. Also consider that if you jump in now, you’d be getting a yield figure which is 20bps lower than what one normally gets (5-year average). That isn’t quite the case with SPYG, which currently offers a figure that is on par with its long-term average.
YCharts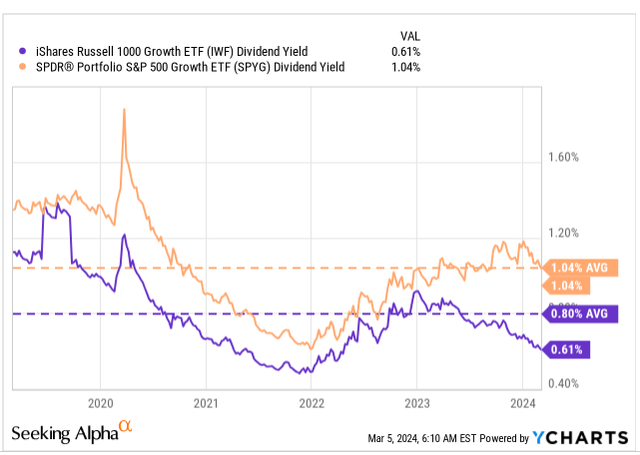
So far, one may not necessarily have made a great pitch for IWF, but investors should also note that hitherto, the quality of stock picking at IWF’s counter has been a lot better.
Note that even though both these products made their debut in the same year, IWF has comfortably outperformed SPYG, by 1.45x.
YCharts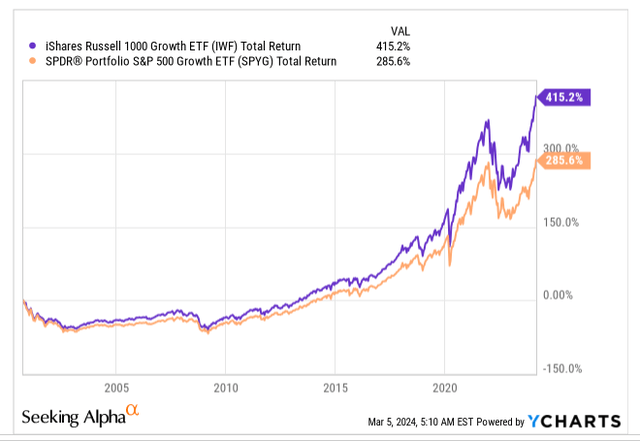
Note that these solid returns have also come despite IWF taking lower risks.
YCharts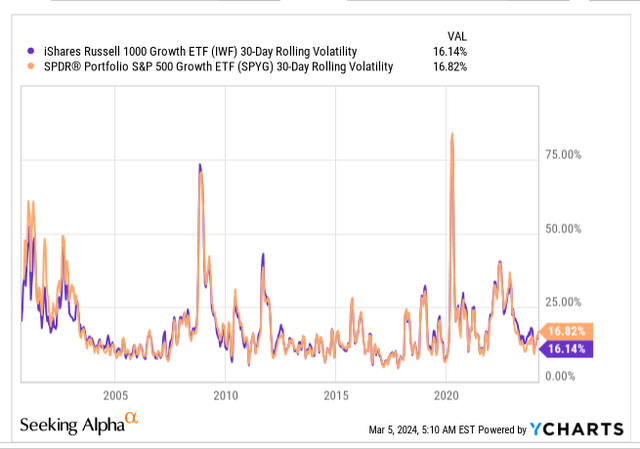
IWF has so far also maintained an excellent track record of risk-adjusted returns. The superior Sharpe ratio over time shows how well this portfolio has done in generating returns over the risk-free rate after considering the total risk taken. Even if only downside deviation is considered, we have a clear winner, with IWF throwing up better Sortino readings than SCHG.
YCharts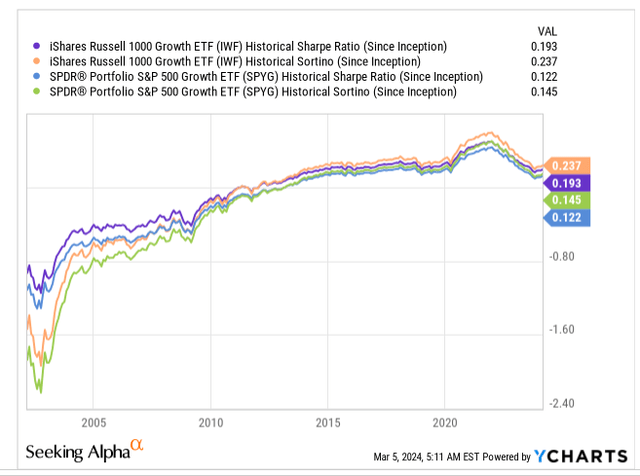
IWF Is Not A Good Buy Now
IWF has largely done well so far, but it is questionable if one will see too much of outsized gains at current levels as the product is currently already perched at lifetime highs.
Investing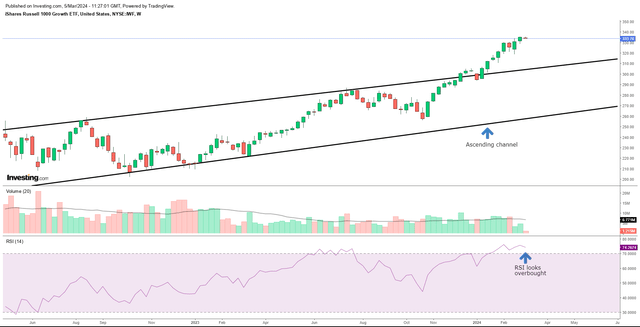
On IWF’s standalone weekly chart, we can see that from May 2022 until late last year, the ETF had been trending up in the shape of a fairly healthy ascending channel (offering useful pullbacks every now and then). However, this year we’ve seen the ETF surge well beyond the upper boundary of the channel and now the price action looks quite overextended to the upside. The overextended stance of this product is further reiterated by the RSI indicator, which is now in the overbought zone.
IWF is, by no means, cheap either; as per Morningstar data, the ETF is now priced at a whopping P/E of 28.58x, which represents a 35% premium over the corresponding weighted average multiple of Russell 1000 stocks. These sorts of steep premium multiples could be justified if one was getting even better earnings growth than what was seen previously, but that does not appear to be the case.
For instance, note that even though IWF covers nearly 450 odd stocks, it is very much a top-heavy portfolio, with the top 10 alone accounting for 52.4% of the total portfolio. Clearly, the earnings fortunes of the top 10 will play a key role in IWF’s prospects.
The table below measures the weighted average forward earnings growth of IWF’s top 10 stocks, relative to what they have typically delivered (the 5-year average). Note that over the next 3-5 years, the top 10 are on average expected to deliver lower earnings growth (19%) relative to what was seen in the past (20%).
Seeking Alpha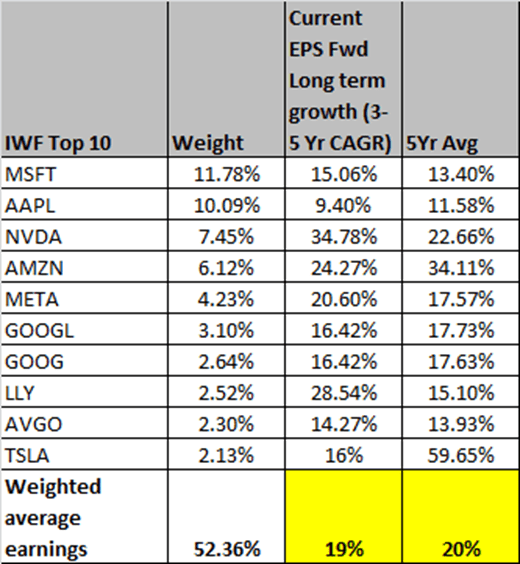
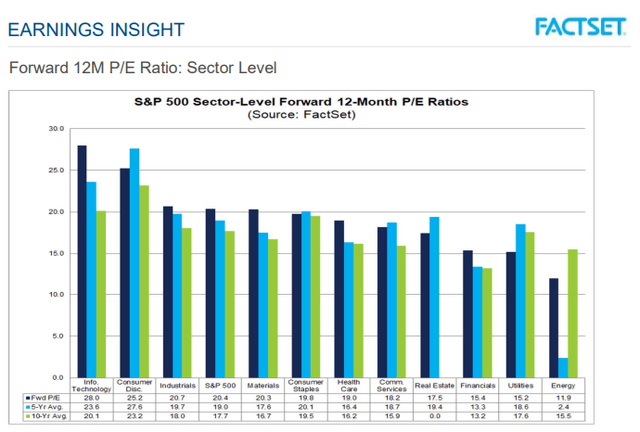
IWF is not just driven by its top 10 stocks, you also have an inordinate tilt towards tech stocks, which jointly account for almost half the portfolio. So far, a lot of these tech stocks have been going up on account of the AI narrative, and whilst that theme certainly has solid merit for quite a few companies, you don’t want to get too carried away expecting a universal uplift for every stock in that sector. For instance, note that in the recent earnings season, the tech sector saw the biggest expansion in blended earnings growth (from previous levels of 15.7% to 22.7%) among all sectors, but if you take out NVIDIA’s impact alone (the poster boy of the AI hype), the blended earnings growth of the tech sector drops by a whopping 1000bps to just 11.7%. Basically, the tech sector’s prospects are being driven by just a few names, and with tech’s share as a function of broader large-caps at record highs, there’s always the risk of a sharp reversal (on a valuation basis note that large-cap tech stocks are the priciest amongst all sectors trading comfortably beyond both its 5-year and 10-year averages).
YCharts FactSet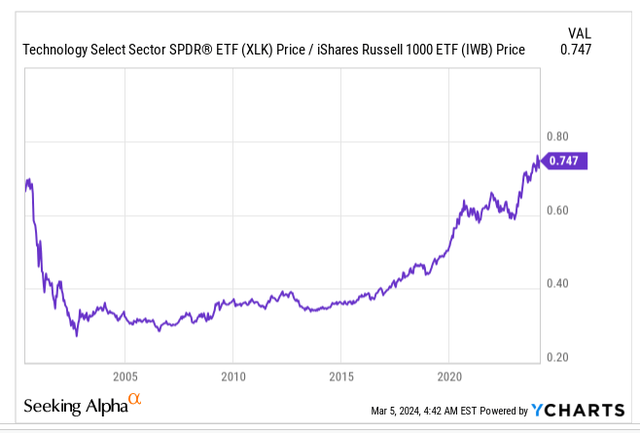
Investors must also weigh the impact of the higher-for-longer stance that is being adopted by the Fed and what this does for the dollar. The dollar index is already up 2.5% this year, and net bets on dollar futures are now positive. For large-cap tech stocks in particular, this is likely to cause some trouble as they generate around 57% of their business from abroad. A pricier dollar damages their competitiveness in the global markets, and when they convert their international revenue back to dollars, they end up garnering a lot less.
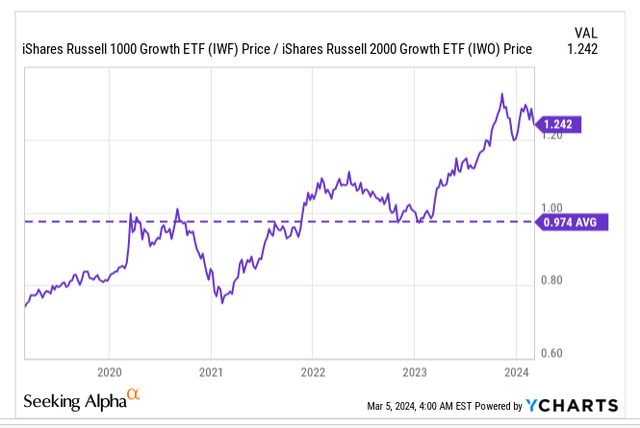
Finally, two other reasons why we would not be too eager to own the growth stocks of Russell 1000 now is because it looks very overbought against the value stocks of Russell 1000, as well as small-cap growth stocks (growth stocks that belong to the Russell 2000). Both the charts below highlight how IWF’s relative strength ratio is now at or around its highest point in five years and a long way off the historical average (making it susceptible to mean-reversion).
YCharts YCharts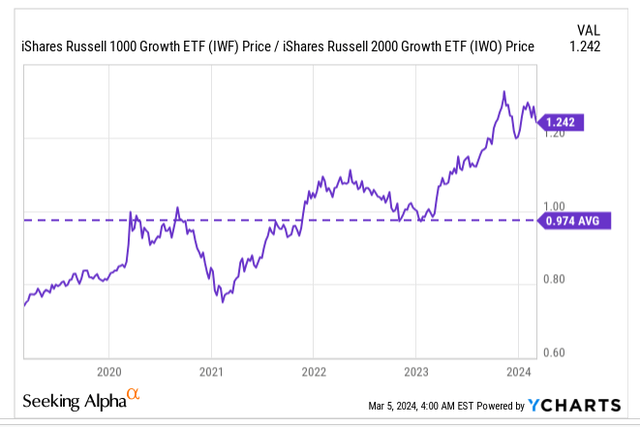

")


