

bluesky85/iStock via Getty Images
The AdvisorShares Focused Equity ETF (NYSEARCA:CWS) is a proprietary low-turnover strategy-based actively managed vehicle that I attempt to cover at least once every few months. The previous time I discussed CWS was in February, when I concluded that the fund did not deserve a Buy rating, with factor exposure being the key reason for skepticism. Since then, CWS has underperformed the S&P 500 index by 1.85%, with the major reasons to be discussed shortly.
Seeking Alpha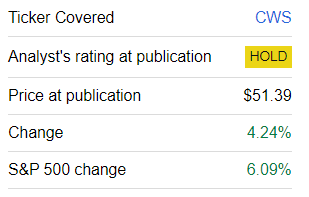
The fund’s investment case document available on its website has the following description of the strategy:
CWS’s investment strategy focuses on firms that are believed to be fundamentally sound and have shown consistent financial results and high earnings quality. The strategy may look for stocks with a strong history of sales and earnings growth, or companies that have steadily increased their earnings and dividends for several years. In addition, the Fund’s assets may be invested in lesser-known companies believed to have a unique opportunity for growth. At times, the CWS may buy certain out-of-favor stocks believed to be priced below their intrinsic value, as measured by the Advisor. Additionally, CWS’s strategy aims to keep the portfolio turnover low.
In other words, CWS offers a unique, concentrated take on U.S.-listed equities. This strategy is essentially a variant of the buy-and-hold philosophy, as the fund has no intention to add or remove holdings frequently.
The idea of today’s note is to provide an update on the fund’s portfolio composition, assess factor exposure changes, and review the detractors from and contributors to its performance since February to arrive at a conclusion about whether the ETF deserves a rating upgrade.
How the portfolio has changed since February
Upon cursory inception, the CWS portfolio has not changed since my February note at all, still encompassing 25 equities, with one difference that can be noticed quickly being Fiserv (FI), previously traded as FISV, now shown in the holdings dataset with the new ticker the company adopted in June as FI transferred its listing from the NASDAQ to the NYSE. However, this exemplary stability masks some notable shifts under the hood. Let us discuss them in greater detail.
First, the table below compares key value indicators and growth rates worth reviewing to gain an understanding of whether CWS’ valuation profile, which was hardly appealing in February, has improved or not.
| Metric | February | August |
| Market Cap | $51.96 billion | $51.097 billion |
| EY | 4.6% | 4.42% |
| EPS Fwd | 9.4% | 6.26% |
| Revenue Fwd | 8% | 5.79% |
| P/S | 4.45 | 4.74 |
| Cash Flow/EV | 3.88% | 3.6% |
Calculated by the author using data from Seeking Alpha and the fund
First, we see a surprising decline in the weighted-average market cap despite the fund delivering an over 4% gain. Anyway, there is no improvement on the earnings yield front, which is only marginally below the 4.59% EY of the iShares Core S&P 500 ETF (IVV). Delving deeper, I see only two stocks with C- and C+ Quant Valuation grades (a 7.7% weight), with the rest of the portfolio having a D- or worse, with the exception being Miller Industries (MLR) which does not have a rating. As the tech rally has clearly lost steam amid questionable inflation data, retail sales pointing to the fact the economy could tolerate even more interest rate hikes, etc., stocks with lofty multiples can still see their premium valuation revised lower by the market. For CWS, which has seen its already fairly unimpressive cash flow yield (Cash Flow/EV) shrinking since February to 3.6%, this risk is especially acute.
However, it is worth being a realist here. The fact is, NVIDIA’s (NVDA) earnings that are due on August 23 remain a wild card. The stock has been a locomotive of the market rally this year, so I reckon a positive EPS surprise will almost certainly result in this rally resuming, lifting all the boats, especially contributing to more expensive stocks’ recovery. It is of note that analysts remain pronouncedly bullish on NVDA’s bottom line, with 33 upward revisions in the last 90 days.
Seeking Alpha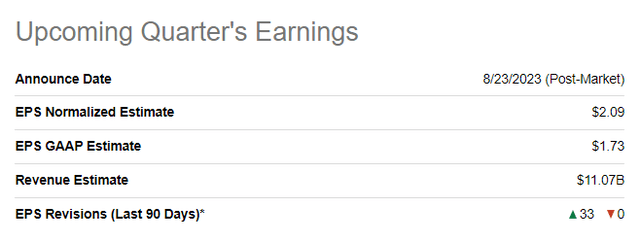
An important remark here is that in the current iteration, CWS has no exposure to NVDA.
Another notable development here is CWS’ growth characteristics deteriorating significantly, with the weighted-average forward EPS growth rate going down by over 3% and the revenue growth rate falling by 2.2%. A few factors can be adduced to briefly explain that:
- Regarding revenue, 17 companies have seen their growth rates reduced, with the most afflicted being Celanese (CE), Stepan (SCL), and Middleby (MIDD), by 17.2%, 10.5%, and 7.7%, respectively. An almost 11% increase in HEICO’s (HEI) revenue growth rate to 25.8% was incapable of offsetting their impact on the weighted average figure.
- Regarding EPS, it was CE that again has seen the most significant reduction, as pundits are now expecting its EPS to decline by almost 11%, while in February, they forecast an 18.9% growth. Overall, 14 stocks have seen their EPS growth prospects downgraded.
In all, I believe the current factor mix is not sufficient for a rating upgrade.
Key contributors to and detractors from performance
There is a complicated story beneath CWS’ 4.2% return since the previous note. Its components did not move harmoniously, with some falling steeply while others were enjoying solid gains. To illustrate that, I have created the following chart by comparing the stocks’ prices in the dataset as of February 1 and as of August 18.
Calculated by the author using data from CWS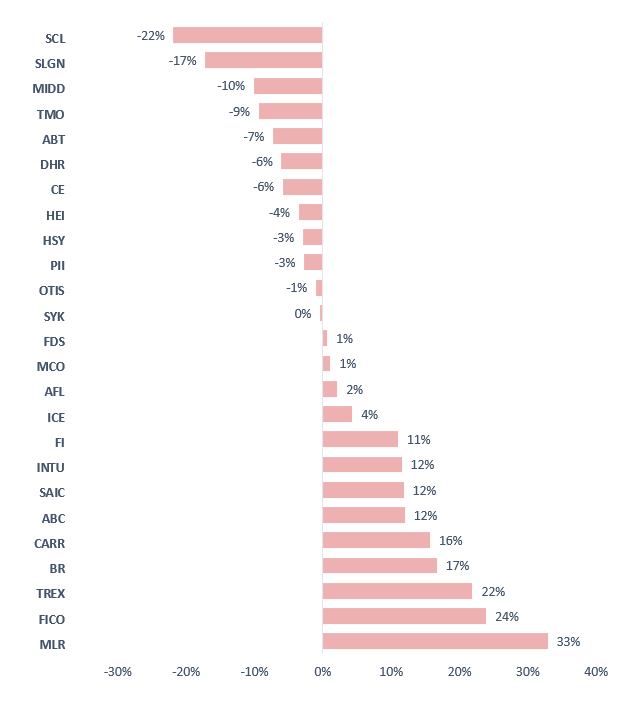
The major disappointment was Stepan, a chemical company generating most of its revenues from the Surfactants segment; SCL declined by about 22%, with its weight in the portfolio falling by 94 bps to 2.89%. Among the reasons for its lackluster performance were its tepid results; a profound reduction in the forward revenue and EPS growth rates mentioned above is telling. At the same time, Miller has contributed grossly to CWS’ return, climbing to 2nd place in the portfolio from 9th, now having a 5.26% weight.
What lies ahead for CWS?
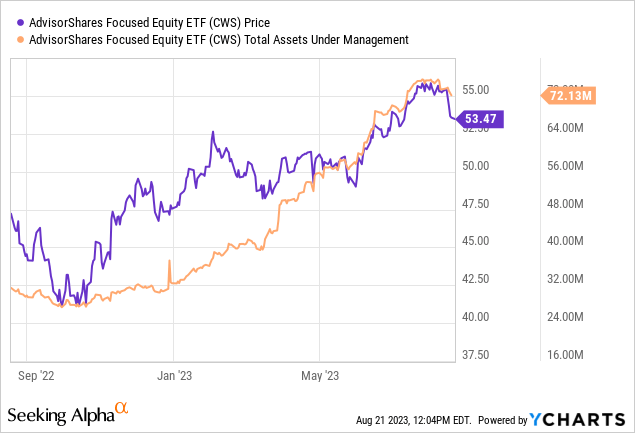
In conclusion, CWS offers a solid assemblage of high-quality stocks, sporting an adequate earnings yield together with acceptable growth exposure (I would prefer a larger one though) even despite the reduced rates. Also, CWS has seen rather solid asset flows this year, with AUM almost doubling since February.
So, constructing a well-rounded bearish thesis is a task close to impossible.
However, I have a tough time believing CWS will be capable of systematically beating IVV in the future, partly because of its sizable management fees; again, they fluctuate depending on its performance, with mechanics described on the website, yet even at 65 bps, the minimum, they are still clearly burdensome. This year, CWS has had a few strong months, outmaneuvering IVV in January, February, and May, with the latter being the strongest month as it beat IVV by 3.48%. Zooming out, this positive impression dissipates. First, in the first 7 months, it still underperformed the S&P 500 fund by 4.1%. And performance since its inception (over the October 2016–July 2023 period, to be precise) is also not supportive of the hypothesis that CWS will be beating IVV consistently over market cycles in the long run, as it neither delivered a higher CAGR nor higher risk-adjusted returns (Sharpe, Sortino ratios).
| Portfolio | IVV | CWS |
| Initial Balance | $10,000 | $10,000 |
| Final Balance | $23,903 | $22,729 |
| CAGR | 13.60% | 12.77% |
| Stdev | 16.46% | 16.86% |
| Best Year | 31.25% | 30.97% |
| Worst Year | -18.16% | -10.42% |
| Max. Drawdown | -23.93% | -22.96% |
| Sharpe Ratio | 0.77 | 0.71 |
| Sortino Ratio | 1.17 | 1.14 |
| Market Correlation | 1 | 0.91 |
Created using data from Portfolio Visualizer
In the meantime, its valuation profile still does not appeal to me; I am not comfortable with 86.7% of the holdings having a D+ Valuation grade or worse. Certainly, I appreciate CWS’ high-conviction approach, but this is hardly enough for a Buy rating.


")


 Q1 2025 Earnings Name Transcript")
