It’s May. This is a financial newsletter. So I’m more or less contractually obligated to talk to you about one of the most popular and practical-sounding rhymes in finance…
“Sell in May and go away.”
Per the industry gold standard on seasonality, the Stock Trader’s Almanac, this simple strategy of selling your stocks in May and buying them again in November is a reliable way to both increase returns and reduce your risk going all the way back to 1950.
And the data backs that up…
| January | 1.2% |
| February | -0.1% |
| March | 0.5% |
| April | 1.5% |
| May | -0.1% |
| June | 0.8% |
| July | 1.6% |
| August | 0.7% |
| September | -1.0% |
| October | 0.4% |
| November | 0.9% |
| December | 1.3% |
We can go back even further, to 1928, and see that May and September are, on average, two of the three negative performing months for the stock market… And the average return each month from May to October is 0.4%, while the average monthly return from the “strong” six months to follow is 0.9%.
Think about that. We’re talking about nearly 100 years of market activity. A period of time that saw World War II … the dawn of globalization … and the invention of television, the cellular phone and the internet.
It seems impossible that such a consistent record of seasonality-driven performance could exist even as the world underwent so much change.
Yet seasonal patterns persisted through it all.
Now, let’s make one thing clear. Averages are exactly that: averages. Every year is different.
But seasonality is still incredibly powerful. It can turn even an average strategy into a great one.
I’ve used it myself to create one of the best short-term trading strategies I’ve personally seen in my career.
It’s so good, I’d argue it defies the “sell in May” mantra altogether. And unless you are a completely hands-off, passive-only investor, you may want to stick around this May and trade the moves I see coming.
2 Days a Week Trounces “Sell in May”
Seasonality patterns go far beyond monthly or even six-month windows.
A couple years back, I identified a regular, repeating pattern that happens every single week, and I’ve found the perfect way to profit from it.
Check out this chart:
On average — there’s that word again! — markets post the worst returns on Mondays and Fridays, with the best returns coming on Tuesdays, followed by Wednesdays and Thursdays. This is based on 25 years of trading data.
When I ran the analysis that led to this chart, a lightbulb went off in my head. The market is showing us a “sweet spot” that we can trade each and every week.
I realized that if I could set up a short-term trading strategy that operates in this 48-hour window, I could benefit from lower prices on Mondays and higher prices on Tuesdays and Wednesdays.
My publisher saw this, coined the name “Wednesday Windfalls” (when we close our trades each week), and we quickly realized it was worth pursuing.
So I got to work.
When I started back testing this new strategy, I had a hunch it would outperform most longer-term seasonal strategies — and make a strong case for trading the market even during its “downtime” with a small portion of your portfolio.
But when I saw the results … I had to double-check them, triple-check them … and tap my analyst Matt Clark for a sanity check.
Check this out…
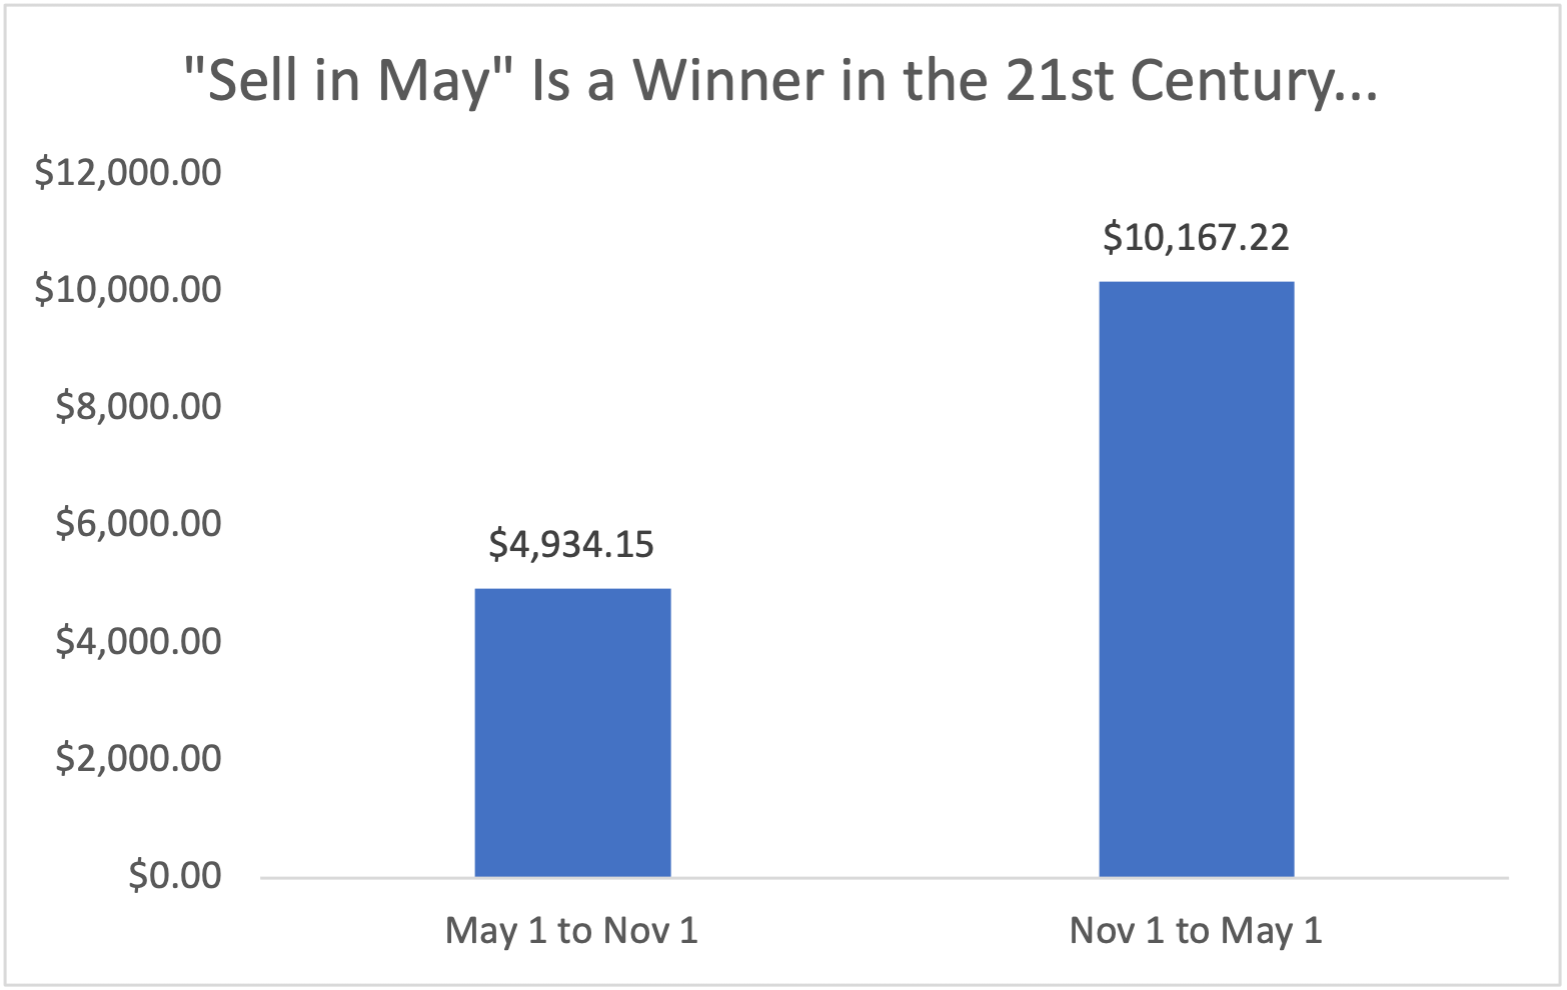
For every year from 2000 to 2022, if you’d bought $10,000 worth of SPY every May 1 and sold it every November 1 … you’d end up with a net profit of $4,934.15.
Not too bad. But if you’d bought that same position every November 1 and sold it every May 1 instead … you’d have $10,157 in profit.

This is great proof that “sell in May” not only still works as a long-term seasonal strategy, it also would’ve more than doubled your money in recent decades.
However, look at the results of the short-term, 2-day trading strategy I invented…

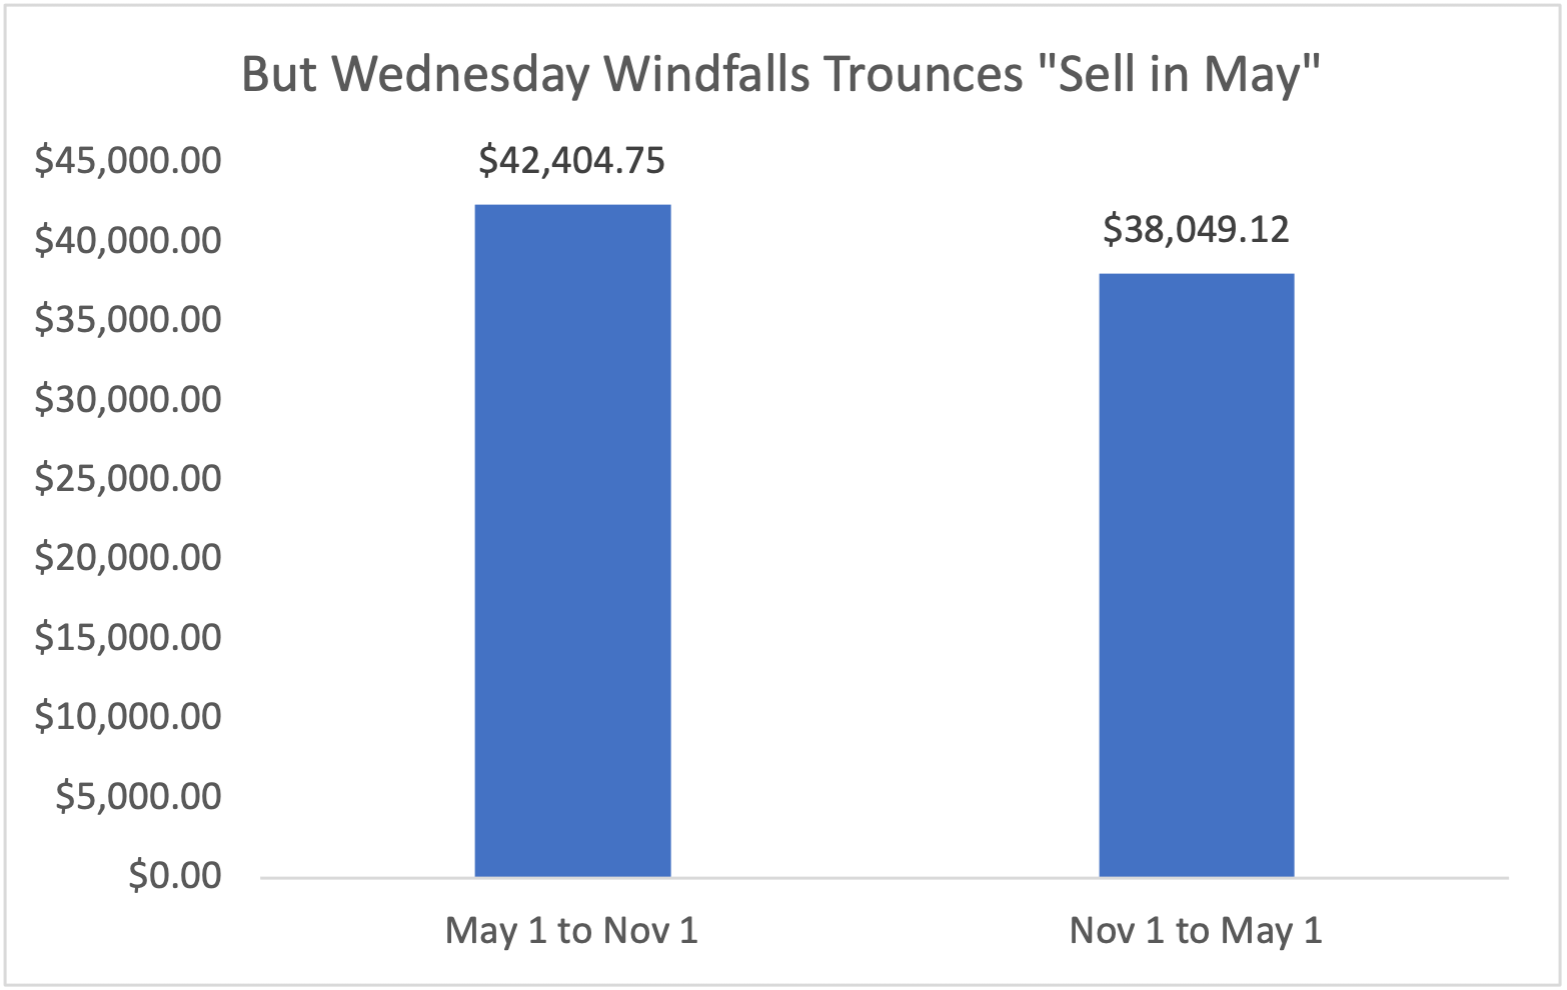
This is what would’ve happened if you bought $10,000 worth of every Wednesday Windfalls signal instead … both during the “worst” period of time to trade and the “best.”
You’ll quickly note that Wednesday Windfalls is actually a better trade over these historically poor-performing months. And the gains you could see are north of 10 times higher than simply investing in the S&P 500.
Now, keep in mind, this is no apples-to-apples comparison. Wednesday Windfalls operates a set of several core principles that cannot be compared to just buying SPY.
- The Wednesday Windfalls strategy is an options strategy. We use short-dated call options to benefit from this two-day window of outsized stock performance. A lot of people are turned off by options, and I get it. Options are billed as a more complex strategy compared to just buying stocks. But, when used with sound risk management and small position sizing, they can be a huge boon to your portfolio with relatively little risk.
- We also don’t just trade the S&P 500. The Wednesday Windfalls strategy aims to trade three different, uncorrelated sectors each week, and targets the best-performing stocks in those sectors, to increase our odds of success. For this study, I used a basket of nine sector exchange-traded funds that best represent the most liquid and well-known sectors of the market.
- The Wednesday Windfalls strategy involves buying each position, and selling each position, at the exact same time each week. Some weeks there are losers that take away from the winners. However, most weeks show a positive return over the long run.
I share all this with you because this famous mantra always rings in the back of my head whenever May rolls around.
Plenty of people are going to close out all their portfolio positions and take the next six month off. And they might not do too bad.
But a select few of them will stick around, “Trade in May and Not Go Away,” and reap huge potential rewards for their effort.
As you’ve gathered, the next Wednesday Windfalls trade will go out tomorrow and close out Wednesday. If you go here, you can learn how to get the details in your inbox in time for the release at 2 p.m. Eastern time.
To good profits,
 Adam O’Dell
Chief Investment Strategist, Money & Markets


