The Beach Path in Sanur, Bali, Indonesia GWMB/iStock Editorial via Getty Images
Introduction
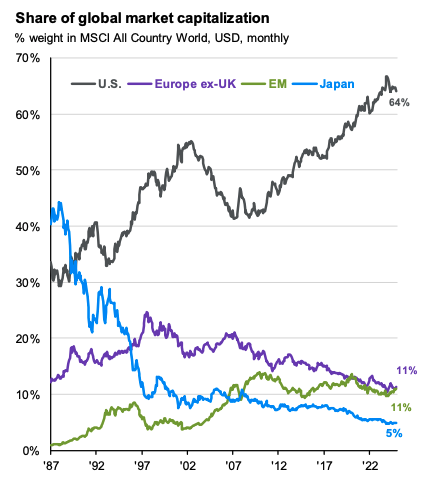
As the U.S. stock markets decline, I have been searching globally for relatively better opportunities. Previously, I have analyzed the UAE, Japan, Turkey, China and International (ex-US) stocks in general. In this piece, we’re moving to the Pacific markets. Let’s see how the countries near the Pacific Ocean stand:
Pacific Markets Are Bottoming Out
The Vanguard FTSE Pacific ETF (NYSEARCA:VPL) tracks the FTSE Developed Asia Pacific Index, which is a proxy for equity markets in the Pacific region. It measures the investment return of stocks issued by companies located in the major markets of the Pacific region.
VPL ETF Composition
VPL ETF Sector Exposure (VPL ETF Website, Author’s Analysis)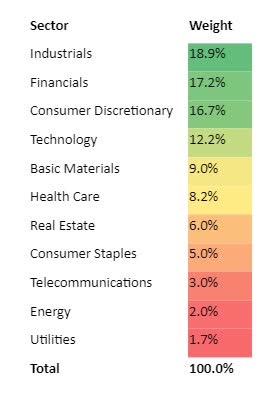
Almost 53% of the VPL ETF is made up of industrial, financial, and consumer discretionary stocks. Notably, there is not as much exposure to deep cyclical sectors such as energy and real estate.
VPL ETF’s Top 5 Holdings (VPL ETF Website, Author’s Analysis)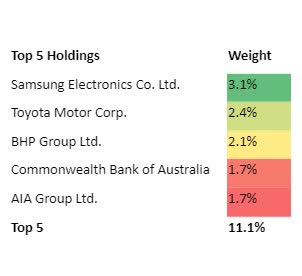
Meanwhile, the top 5 holdings only make up 11.1% of the overall index. As a result, the VPL ETF is a good choice for investors seeking low, unsystematic (diversifiable) risk. The top 5 holdings of the exchange-traded fund (“ETF”) include Samsung Electronics (OTCPK:SSNLF, OTCPK:SSNNF), Toyota Motor (OTCPK:TOYOF, TM), BHP Group (BHP, OTCPK:BHPLF), Commonwealth Bank of Australia (OTCPK:CBAUF), and AIA Group (OTCPK:AAGIY) (OTCPK:AAIGF).
VPL ETF Geography Composition (VPL ETF Website, Author’s Analysis)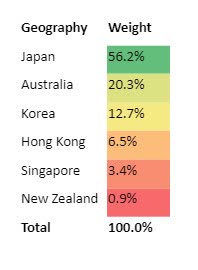
Though geared towards investing in equities in Asia Pacific nations, the VPL ETF is heavily exposed to the Japanese market, with more than 56% of overall exposure coming from Japan. As such, economic developments in Japan holds significant sway on the VPL ETF. For this reason, it is important to:
Keep the Japanese Manufacturing PMI in Focus
Given Japan’s heavy exposure and the fact that the Japanese equity markets are geared towards industrials, Japanese manufacturing PMIs is a key monitorable to ascertain the future prospects of VPL:
Japan Manufacturing PMI (Trading Economics)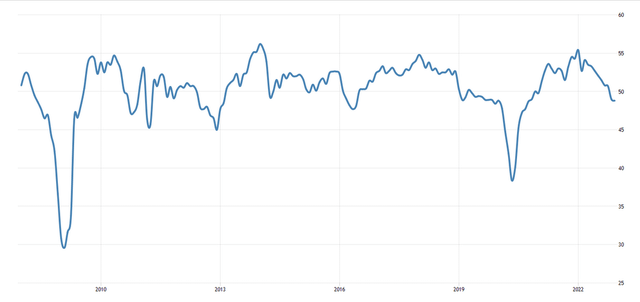
The Japanese Manufacturing PMI has dipped below 50 for two consecutive months now, indicating that industrial activities are contracting. This is driven by subdued demand and cost pressures.
If we get a return back above the 50 mark, this would indicate a relatively more bullish tone for Japan and hence an incrementally rosier outlook for the VPL ETF.
With that fundamentals based tracker in mind, I now look at how the technicals are shaping up to help time my moves:
If this is your first time reading a Hunting Alpha article using technical analysis, you may want to read this post, which explains how and why I read the charts the way I do, utilizing the principles of Flow, Location, and Trap.
Read of Relative Money Flow
VPL vs S&P500 Technical Analysis (TradingView, Author’s Analysis)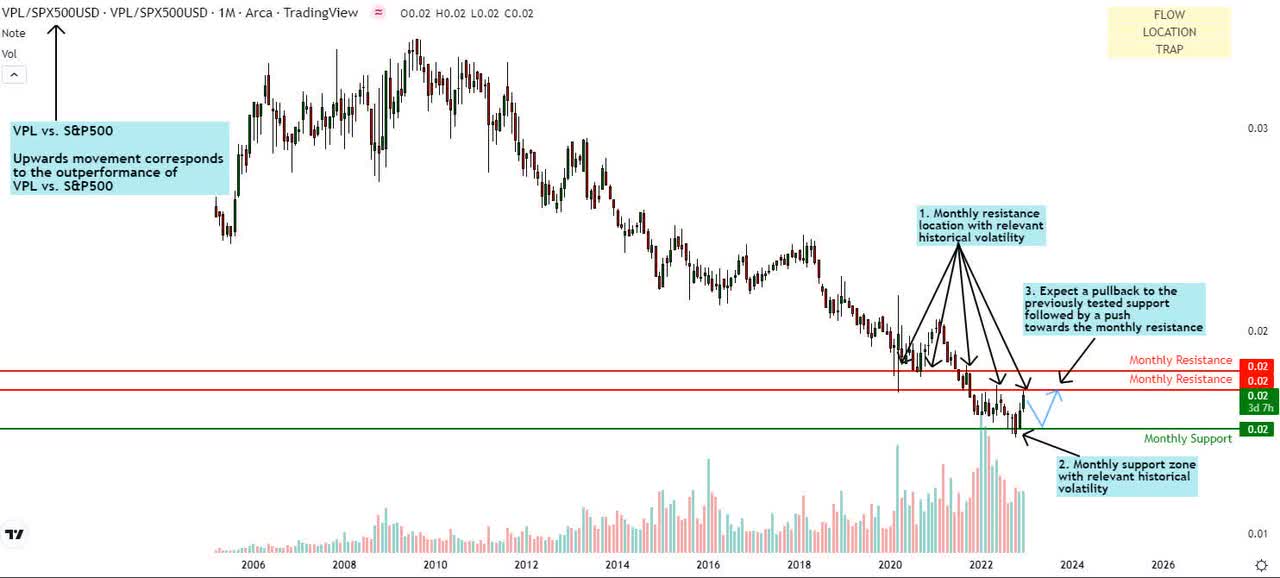
An upward movement on the relative chart of VPL/SPX500 means VPL is outperforming the S&P 500 Index (SP500). Conversely, a downward movement means it is underperforming the S&P 500.
The VPL/S&P 500 pair is challenging its previously bearish trend with a slight increase near a previous high, reinforcing that the trend is bottoming out. However, I need to see a retest of the monthly support and ideally a false breakout to the downside to confirm that the bearish trend has indeed been lifted.
In this case, I anticipate a retest of the monthly resistance, where a trend reversal will be confirmed. If not, the original bearish trend would simply resume. Thus, I’m tilting towards a “hold” stance on the VPL/S&P 500 pair as I await confirmation of the trend.
Read of Absolute Money Flow
VPL Technical Analysis (TradingView, Author’s Analysis)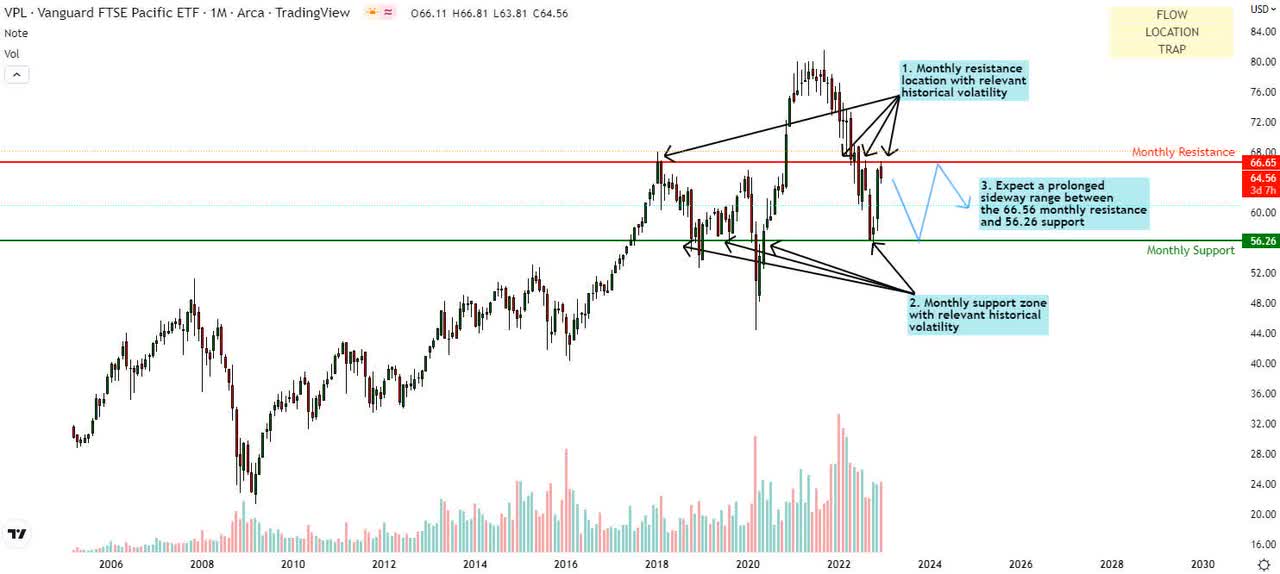
On the standalone VPL chart, the price appears to adopt a looser outlook. Prices recently faced the historical monthly resistance at $66.65 but failed to breach the mark. Instead, I think VPL will now approach the monthly support at $56.26.
I see a sideways pattern taking shape in the longer term, with the price being restricted between the monthly support and resistance bands highlighted in the chart.
Summary
Overall, I reserve a floating or “hold” outlook on the VPL vs. S&P 500 pair as well as the standalone VPL ETF. Whilst the Vanguard FTSE Pacific ETF charts show that a base is building and there is a pause from incumbent downtrends, there is no evidence of a trap yet to initiate a reversal. This turnover of the overall trend may be sparked by the Japanese PMIs moving back into expansionary territory over 50. Thus, I will be keeping a close eye on this monthly economic release in 2023.


