

tiero
Please note that this week is the quarterly Master List fundamentals update. Every quarter, after earnings, I update all necessary fundamentals for the DK 500 Master List, which enables valuation-based ratings to operate automatically in real time.
Thus, this is the reason for just one article this week.
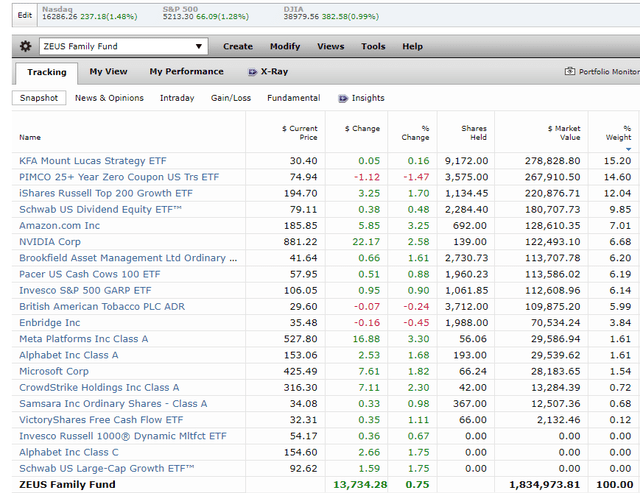
Here’s my ZEUS Family fund holdings’ weekly economic update and actionable idea.
ZEUS Family Fund Summary: A Bad But Completely Expected Week
This week, rising interest rates caused the market to experience a micro dip, and it’s essential always to use percentages to keep things in context.
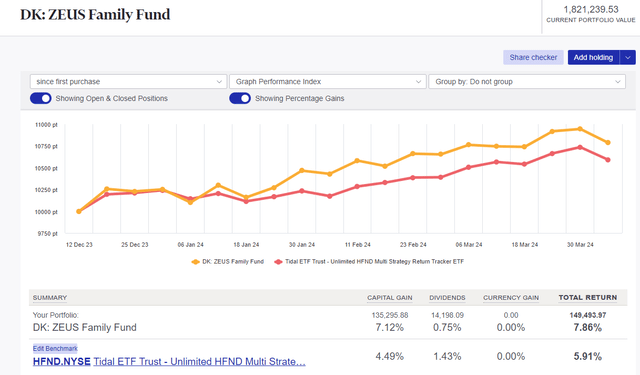
ZEUS Charity Hedge Fund | |
| Portfolio Value | $1,821,240 |
| Historical Downside Capture | 0.6266 |
| Record High Date | 4/1/24 |
| Record High Profit | $156,576 |
| Below Record Profit | $38,928.13 |
| Distance From Record High | 2.14% |
| Total Profit | $117,648 |
| Monthly Profit | $28,644.70 |
| Weekly Profit | $7,161.17 |
| Daily Profit | $1,023.02 |
| Hourly Profit | $42.63 |
| Minute Profit | $0.71 |
| Second Profit | $0.01 |
When the fund launched in December, Morningstar estimated a potential 26% fundamentally justified gain in the first year, equating to approximately $480,000 in profits or approximately $9,230 weekly.
- For the overall strategy, including outside money available to invest later.
- 14% undervalued = 16% upside to fair value + 8.5% weighted earnings growth +3.5% dividends
What’s so remarkable is that the ZEUS Family Fund has been following the fundamentally justified total return potential path like a rail.
This is very unusual, as the stock market is known for its volatility, which is why stocks are considered a “risk asset.”
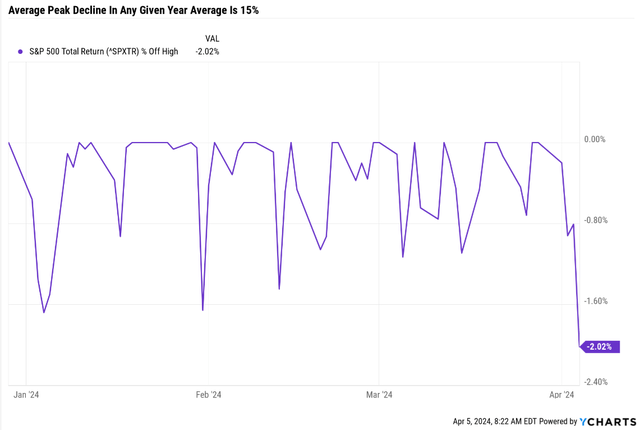
Ychart
The S&P has experienced only a 2% peak decline this year.
The average historical intra-year decline is 15%.
Stocks are up 76% of the time in any given year, and in any given year, they average a 15% peak decline at some point on the way to historically average 10% gains.
The average annual return in an up year is 22%, and the average decline in a down year is -12%.
Sharesights
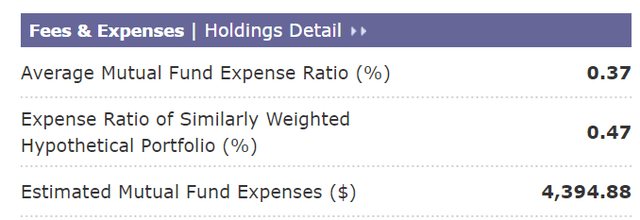
HFND is the DBMF of hedge fund ETFs. It’s run by former Bridgewater head of Macro research Bob Elliott, who uses AI machine-learning algos to estimate the entire hedge fund industry’s positioning in a single “low-cost” ETF.
- A 2% expense ratio is 60% lower than what the hedge fund industry charges
- it’s 5X higher than the 0.38% that my family is paying for ZEUS.
Morningstar
In HFND, we’d be paying $37,000 in annual fees.
Dividend King ZEUS Portfolio Tracker
HFND is designed to earn 8% post-fee total returns in the long term, beating the 60-40’s historical 7% with slightly lower volatility.
ZEUS Family fund is designed to generate SCHD-like yields with far superior returns to the hedge fund industry and 8X lower fees.
I’m trying to prove that the hedge fund industry’s use of complex strategies, like global macro, long/short, private credit, event-driven investing, etc., is unnecessary for good results.
- Historically, 67% of hedge fund net profits come from trend following, according to AQR.
Simplicity is the ultimate sophistitication.” – Lenardi Da Vinci
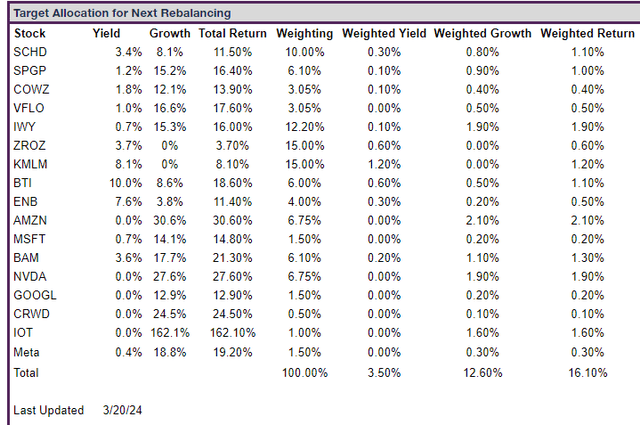
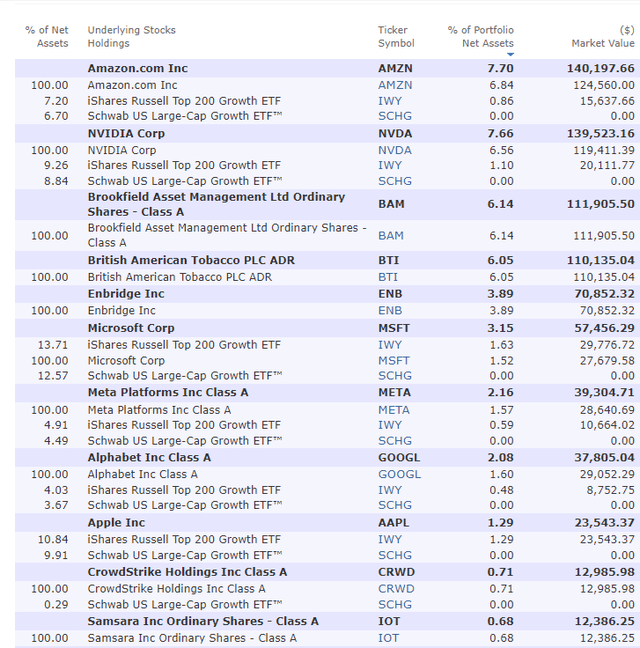
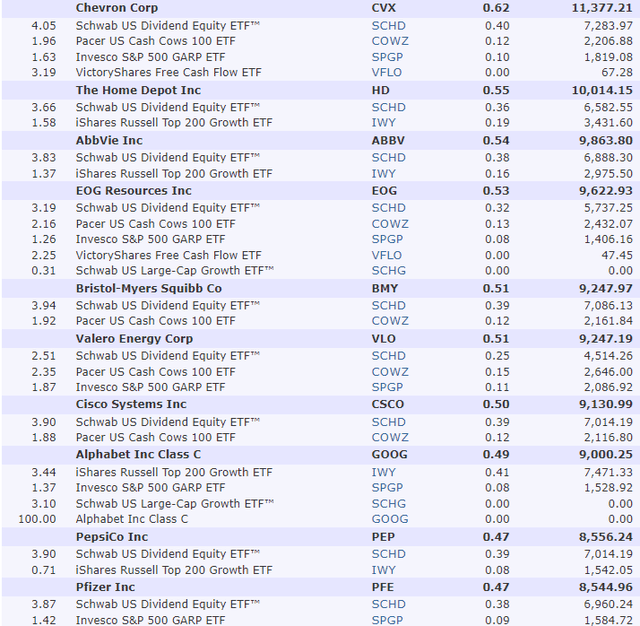
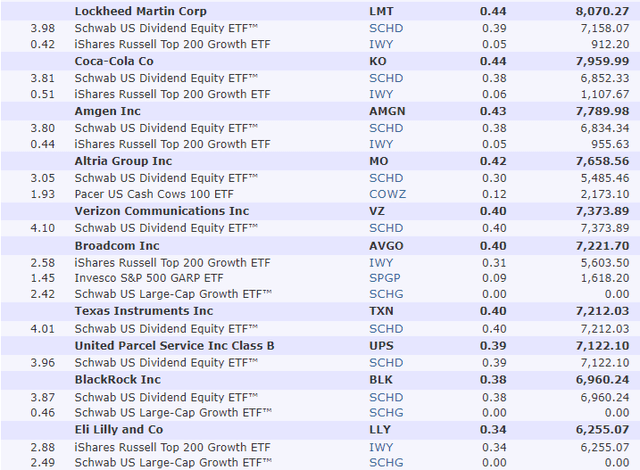
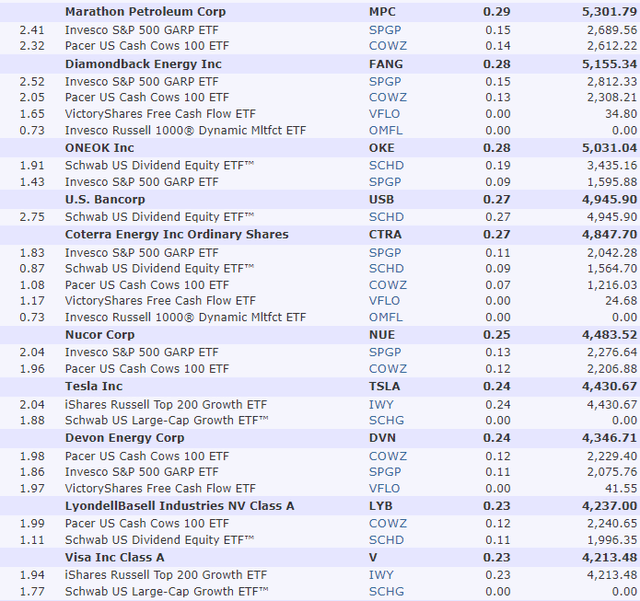
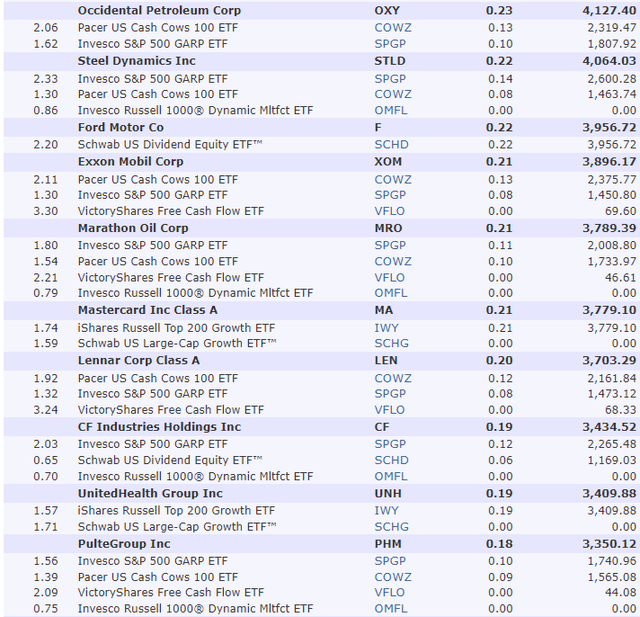
What ZEUS Looks Like Now
Morningstar
10 Largest Holdings: 41.32% Of Portfolio vs. 32% S&P 500
20 Largest Holdings: 47.19% Of Portfolio vs. 42.1% S&P 500
30 Largest Holdings: 51.63% Of Portfolio
40 Largest Holdings: 54.21% Of Portfolio
50 Largest Holdings: 56.27% Of Portfolio
Morningstar
Morningstar
Morningstar
Morningstar
Morningstar
Morningstar
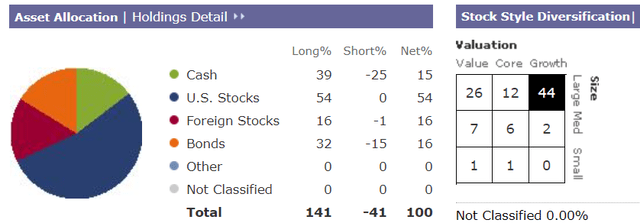
We’re invested in four asset classes courtesy of ETFs like KMLM.
Nicely balanced between growth, value, yield, and 17% exposure to small and mid-cap companies.
- Which benefit most from economic accelerations.
Morningstar
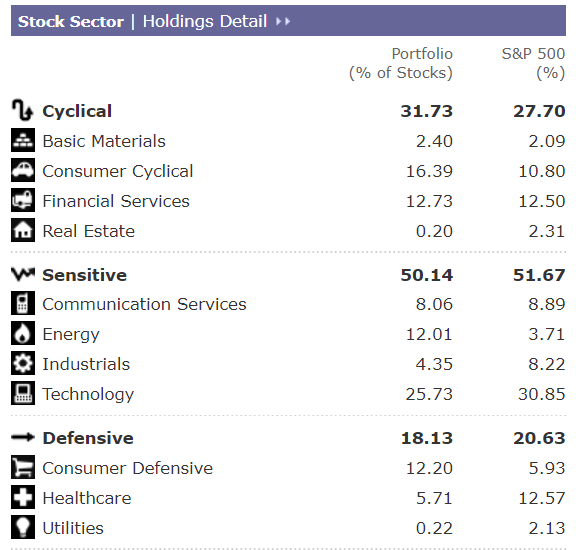
Tilted toward tech but good sector diversification overall.
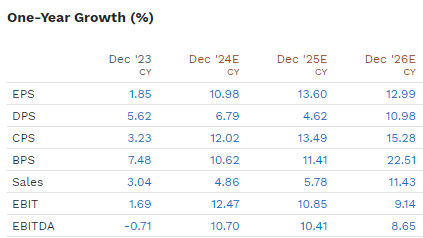
Stock Fundamentals
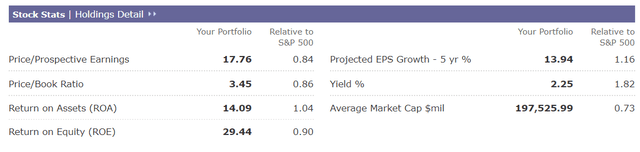
Morningstar
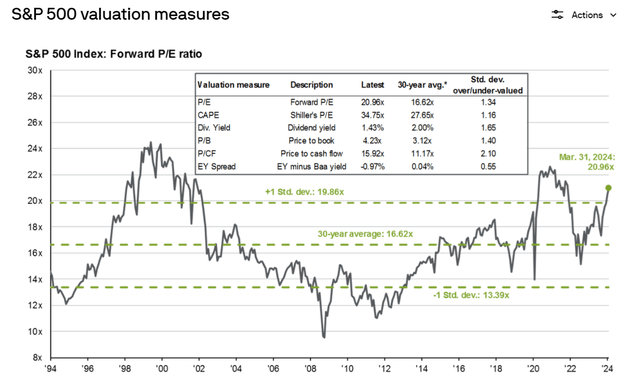
For context, the S&P is trading at a forward PE of 21.1, and Morningstar’s analysts estimate its earnings will grow by 12% over the next five years.
- S&P PEG ratio: 1.76 (1.18 cash-adjusted)
- 20-year average PEG: 3.54 (2.17 cash-adjusted)
ZEUS Family is trading at a PEG of 1.27 and adjusted for cash on our company’s balance sheet it falls to under 1.
- Growth at a reasonable price or GARP.
Market Outlook/Valuation: What The Bears Are Getting Wrong
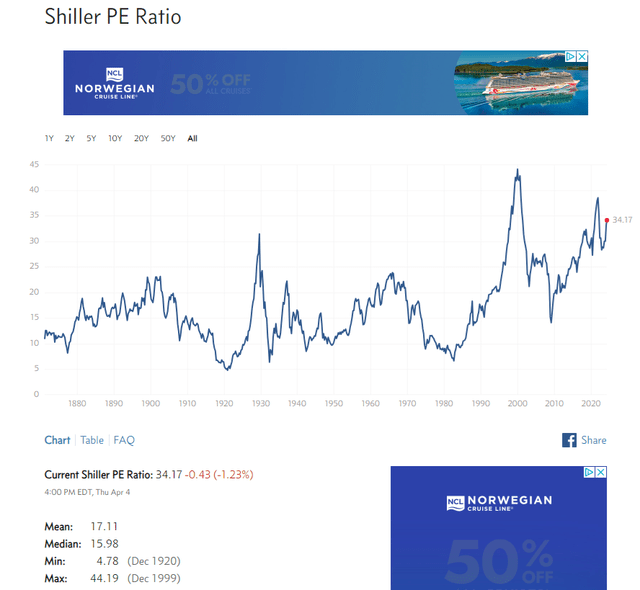
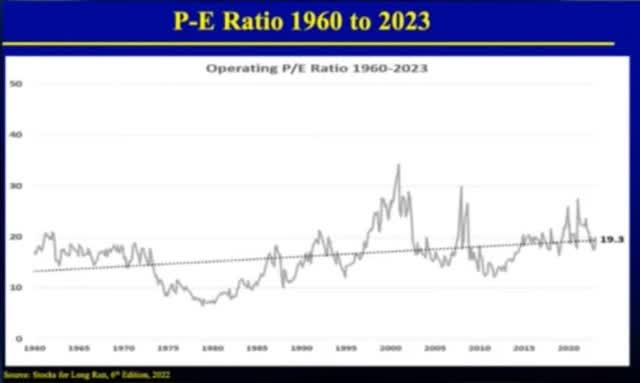
You might hear about Shiller PE, PE, book value, dividend yield, and many valuation metrics.
Multipl
Looking back to 1871 for a sense of where US stocks should be valued today is incorrect for many reasons.
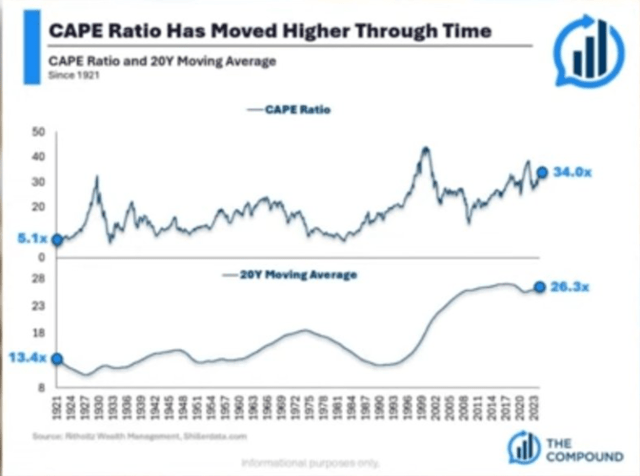
Ritholtz Wealth Management
Guess what the 20-year average CAPE is? 26X, a lot less scary.
Dividend Kings S&P 500 Valuation Tool
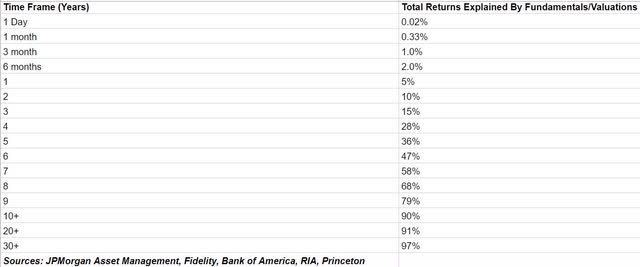
And what’s the percentage of returns explained by fundamentals over 20 years? 91%.
In other words, once you get to 10-30 years, you have enough historical data to make a 90%-97% probability that whatever the valuations we’ve seen are the market-determined fair value stocks will return to.
- The probability that bubbles can last 30+ years is 3%
- The probability bubble can last ten years is 10%
Ritholtz Wealth Management
US stock PEs have been rising for decades, long before rates peaked in 1980 and trended lower for 40 years.
- The rise of retail investors.
- The introduction of 401Ks in the 1980s (automated flow of cash into stocks every two weeks).
- Foreign investors are now able to buy US stocks.
- Rise of big tech (wider moat, higher margin, higher quality companies).
Ritholtz Wealth Management
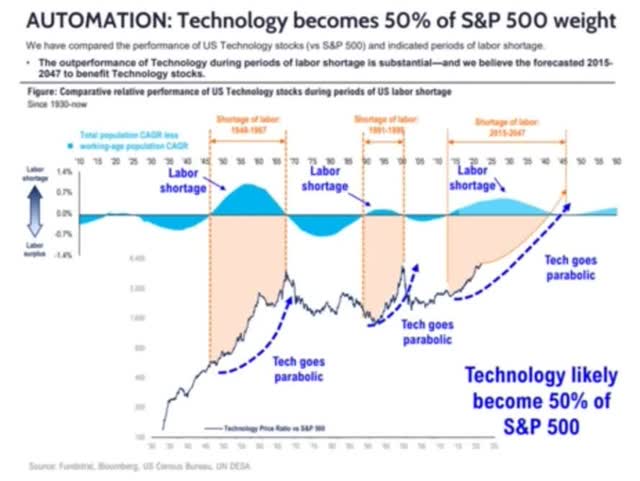
According to Tom Lee at Fundastrat, a secular labor shortage through 2047 could cause technology, whose AI productivity boost will solve that shortage, to grow earnings so quickly that by 2047, the S&P will go from 30% technology to 50%.
- Including GOOG, Meta, and AMZN (which are not officially tech stocks), likely around 75%.
In 1900, 66% of the US stock market was railroads, not industrials, just railroads.
Tech is more profitable than industrials, and today’s tech stocks offer utility-like products and services that create monthly recurring revenue. That’s why S&P PEs rising steadily are both expected and justified by fundamentals.
Why Professional Money Managers Aren’t Worried About An Imminent Crash
JPMorgan Asset Management
Stocks look less overvalued when viewed in more reasonable 10—to 30-year time frames (90% to 97% statistically significant).
Pacer
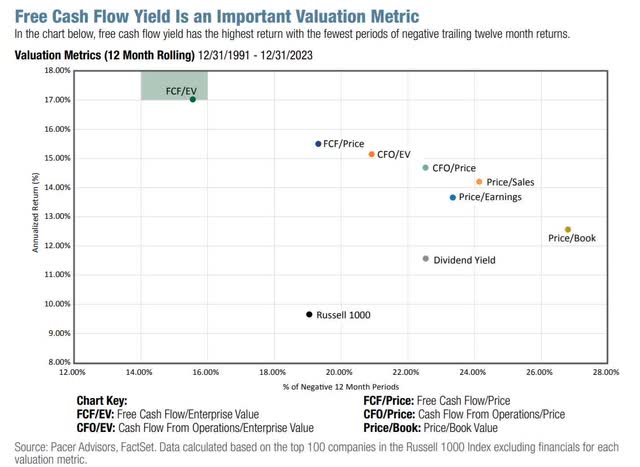
When we look at the most accurate metric of the last 33 years, enterprise value/cash flow, the market is barely overvalued.
- Enterprise Value = market cap + debt – cash (the cost of buying the company)
S&P EV/EBITDA
| Week | 14 | |
| % Of Year Done | 2024 Weighting | 2025 Weighting |
| 26.92% | 73.08% | 26.92% |
| Forward S&P EV/EBITDA (Cash-Adjusted Earnings) | 10-Year Average (90% statistical significance) | Market Overvaluation |
| 14.00 | 13.46 | 4.41% |
| S&P Fair Value | Decline To Fair Value | |
| 4,948.27 | 4.22% |
(Source: Dividend Kings S&P Valuation Tool)
And guess what? There is another vital factor to consider in valuation, as Peter Lynch’s growth at a reasonable price points out.
- PEG ratio = PE (or any EV/cash flow)/future earnings growth
The 25-year average EV/EBITDA/Growth (cash-adjusted PEG) for the S&P is 2.17.
Today, the S&P’s EPS growth estimate from Morningstar is 12%, 2X the historical rate (and 3X faster than the last 25 years).
- 1.17 cash-adjusted PEG vs. 2.17 25-year average.
Morningstar’s analysts are bullish on the S&P due to the rise of big tech, which is growing at 15%.
FactSet Bottom-Up Growth Consensus (3,500 Analysts)
FactSet Research Terminal
The FactSet bottom-up consensus (92% accuracy rate over the last 20 years, according to FactSet’s John Butters) is for 12.5% EPS growth through 2026, similar to Morningstar’s bottom-up analyst estimate.
- Top-down estimate: Analysts “guess” S&P earnings growth based on the economy.
- Bottom-up: Take every company in the S&P 500 EPS consensus growth and weight by the same weighting in the S&P.
Could earnings growth be wrong? Sure. But even if the S&P’s earnings grow 50% as fast as expected, the S&P will still only be about 4% historically overvalued.
Economic Update: Another Blowout Jobs Report
FactSet Research Terminal
- 3-month rolling average: 260K.
- Last month’s revised estimate: 270K.
- This month: 303K.
Moody’s considers 225K monthly jobs consistent with 1.8% GDP growth and 250K a “strong economy.”
Wage growth came in at 4.1% year-over-year, ahead of CPI and Trulfation’s real-time inflation estimate.
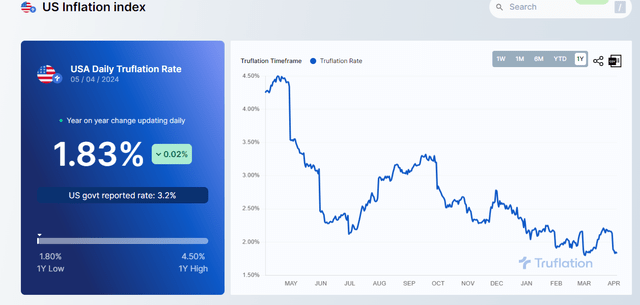
Trulfation
- Truflation uses 10 million data points, updated daily, to estimate real-time inflation.
- 97% correlation with CPI since 2012.
The Fed wants to see wage growth of 3.5% and inflation of 2% for a 1.5% real wage growth.
- Real wage growth: wage growth – inflation.
The monthly wage growth of 0.3% is 3.7%, approaching the Fed’s target.
- Wages – productivity = inflation.
- 4.1% YOY – 3.2% productivity = 0.9% CPI potential (if today’s data continues to hold).
- 3.7% annualized wage growth – 3.2% productivity = 0.5% CPI potential.
Digging Into The Numbers: What The Media Doesn’t Tell You Matters That Does
- Construction jobs (a leading indicator of recession)
Construction added 39,000 jobs in March, about double the average monthly gain of 19,000 over the prior 12 months. Over the month, employment increased in nonresidential specialty trade contractors (+16,000).” – Bureau of Labor Statistics
The most economically sensitive industries are producing jobs at a healthy rate. The housing market, in general, appears to be recovering, which is a tailwind for the economy.
Note 16K monthly construction job growth with 8% mortgages. The genius of American capitalism is we adapt and overcome and just keep growing in the face of what might seem like overwhelming odds.
- Non-supervisory wages (80% of Americans)
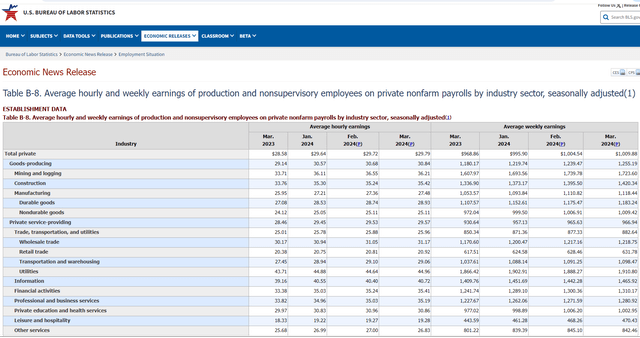
Bureau of Labor Statistics
4.25% annual wage growth and 4.25% weekly earnings (wages X hours worked).
So, it is slightly better than 4.1% overall wage growth and 3.7% annualized.
The Fed will be happy this is trending lower but faster than inflation.
- 3-Month rolling average of job growth
The change in total nonfarm payroll employment for January was revised up by 27,000, from +229,000 to +256,000, and the change for February was revised down by 5,000, from +275,000 to +270,000. With these revisions, employment in January and February combined is 22,000 higher than previously reported.” – Bureau of Labor Statistics
The three-month rolling average on job growth is now 277K, trending higher.
- 608K in 2021 (Pandemic recovery)
- 400K in 2022 (also Pandemic recovery)
- 258K in 2023 (earnings, housing, industrial recession, highest rates in 20 years)
- 277K in 2024 YTD vs 171K 2010 to 2020
We’re creating net jobs at a rate of 3.3 million per year, 1.2 million more annual net jobs than from 2010 to 2020.
- We’re creating jobs at a 38% faster growth rate than Pre-pandemic levels.
What does this likely mean for GDP growth?
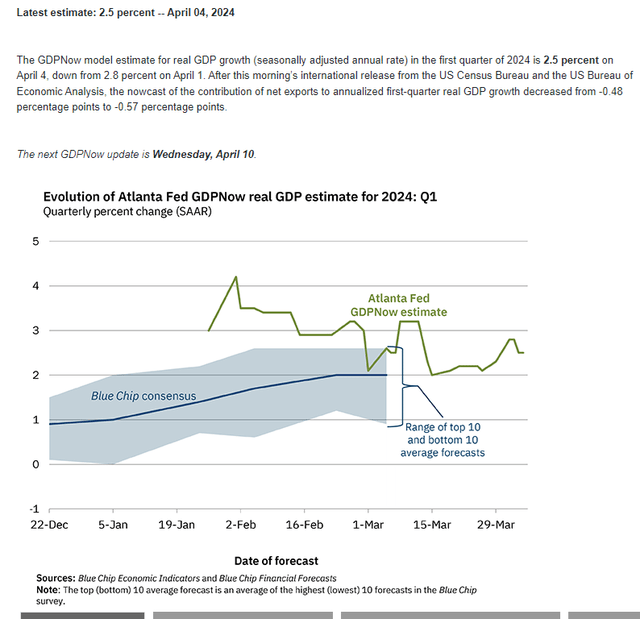
Atlanta Fed
The blue-chip economist consensus thinks growth is currently 2%, and the Atlanta Fed’s model says 2.5%.
- Not including today’s blowout jobs report.
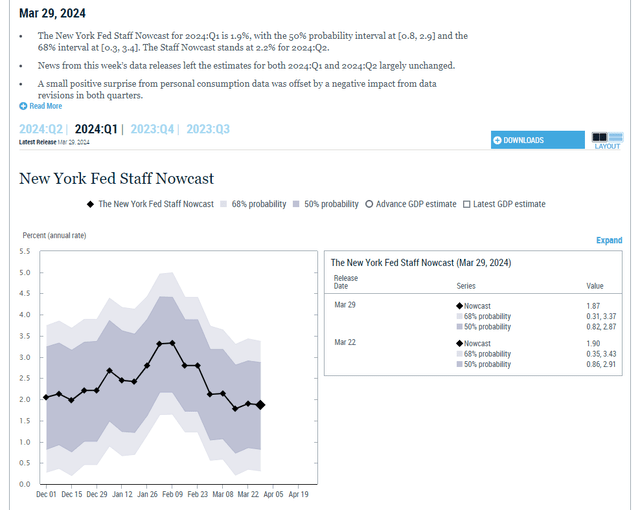
New York Fed
The New York Fed’s model also estimates around 2% growth this quarter.
New York Fed
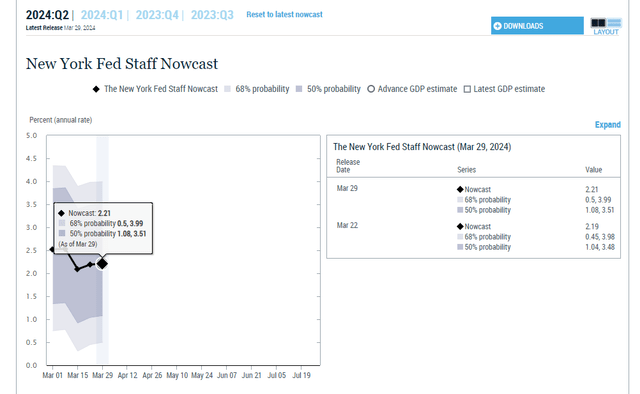
The New York Fed expects a modest 0.3% GDP growth acceleration in Q2, and that’s before today’s blowout jobs report is factored in.
How fast could GDP growth reach based on today’s fundamentals?
The current net migration rate for the U.S. in 2024 is 2.768 per 1000 population, a 0.73% increase from 2023.
The labor force is growing at 0.6% per year, 2X the rate JPMorgan expected this decade.
- GDP growth = Productivity growth (3.2%) + labor force growth rate (0.6%) = 3.8%
In other words, if current productivity growth rates hold and our workforce keeps growing at the current rate (people rejoining the workforce or immigrants getting jobs), the US economy could continue accelerating from 2% to 2.5% growth now to 3.8%.
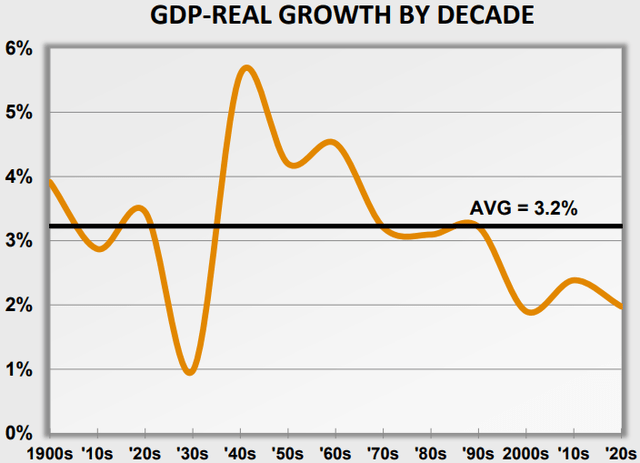
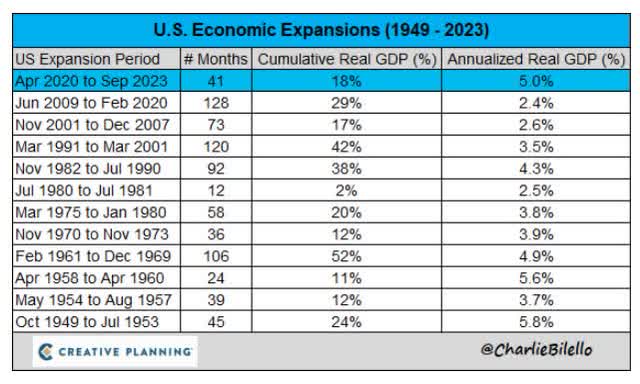
Crestmont Research
Crestmont Research
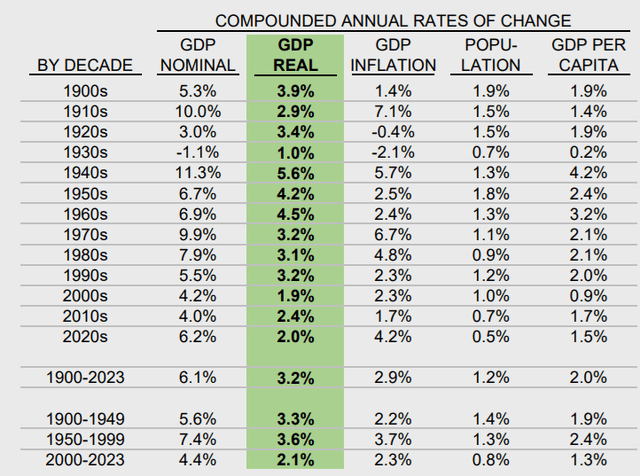
How has the US economy been growing since the Pandemic ended? The fastest rate in 83 years.
Charlie Bilello
And while growth is likely to slow, McKinsey thinks that GDP growth might accelerate from 4.2% to 6.5% thanks to AI.
Most people overestimate what they can achieve in a year and underestimate what they can achieve in ten years.” – Bill Gates
What about inflation and interest rates? What does a potential re-acceleration of US economic growth to 3%, or even 4% or more, mean for inflation and interest rates?
Inflation/Interest Rate Update: PCE Report As Expected But Bond Market Reacting To Hawkish Fed Talk
Although the market was closed for Easter last Friday, the Personal Consumption Expenditure (PCE) inflation report was released.
FactSet Research Terminal
As expected, the core PCE was 2.8% last month, down from 2.9% the previous month.
Cleveland Fed Daily Inflation Model
Cleveland Fed
The Cleveland Fed’s real-time model predicts that Core PCE will fall to 2.7% at the end of April and 2.6% at the end of May.
As Powell has indicated, the month-over-month rate is expected to keep drifting lower at a crawl but potentially give the Fed the cover it needs to start cutting later this year.
- Powell told the Senate he wants to cut in July.
- The Fed Chairman usually gets his way.
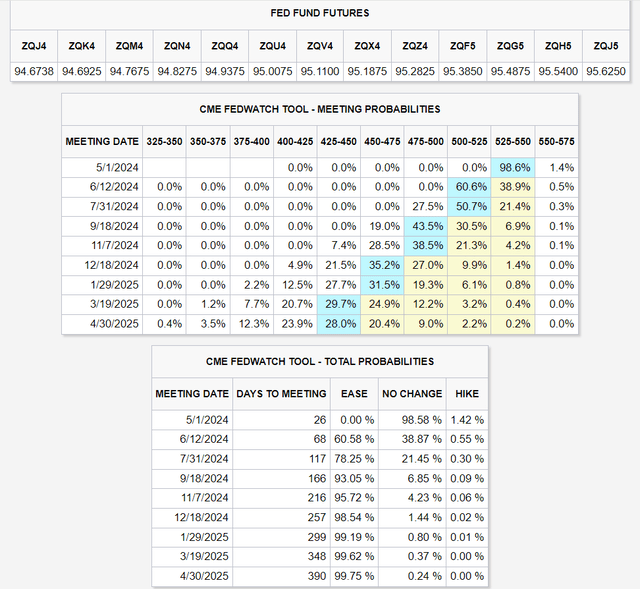
CME Group
The bond market is starting to price in the possibility that the Fed doesn’t cut until September.
- Since 2008, according to the Fed futures market, the Fed has always done what was an 80%-plus probability.
The bond market thinks three cuts are coming this year, just as the Fed’s Dot plot says.
- Fed’s Dot plot shows median forecasts for interest rates by all 19 FOMC members.
There is now a slight chance that the Fed might hike rates again, just 1.4%.
- A-credit rating = 2.5% risk of bankruptcy
- The risk of another Fed hike is 50% less than Home Depot going bankrupt in the next three decades.
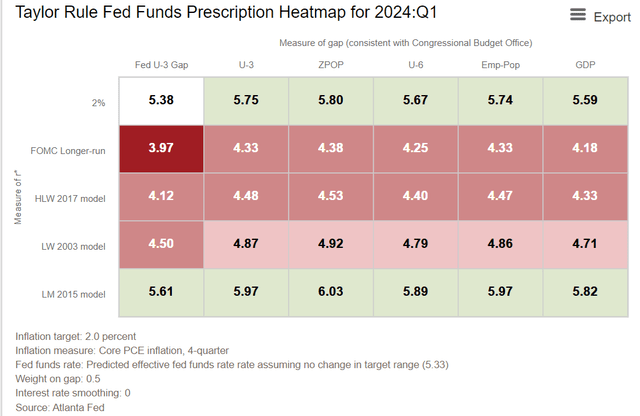
Atlanta Fed
In a “worst case” rate scenario, the Fed might have to hike twice and leave rates at 5.75% to 6% for years.
This would likely mean that two-year yields would rise to 5.5% to 6%, 10-year yields would rise to 6% to 6.5%, and 30-year yields could potentially reach 7%.
Wouldn’t that be catastrophic for stocks? No, not likely.
Investing Lesson Of The Week: Good News Is Always And Forever Good News
There’s no wage-price spiral or significant commodity disruption like the 1970s twin oil shocks.
The only way inflation stays above 3% or hits 4% (forcing the Fed to hike to around 6% and keep rates there) is a booming economy.
Productivity growth from technology is deflationary.
So, where might inflation come from?
70% of the economy is consumer spending, and consumers are spending.
Pandemic plus worst inflation in 42 years, plus fastest interest rate increases in decades, plus 8% mortgages plus worst bond bear market in history, two bear markets in four years…and 25% annual returns for buy and hold investors.
Ritholtz Wealth Management
This is the genius of American capitalism in all its splendor.
Ritholtz Wealth Management
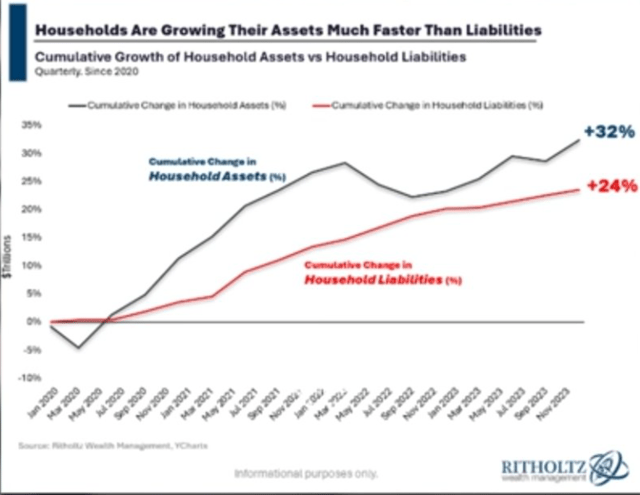
Americans are wealthier than ever, and the job market is the best since 1951 and seems to be getting stronger.
Net worth is growing at an accelerating rate, including $33 trillion in home equity that, when mortgage rates finally do fall, could unleash trillions in cash-out refinancing and Home Equity Lines of Credit borrowing.
- If US consumers borrow 1% of their home equity, $330 billion = 1.5% GDP boost.
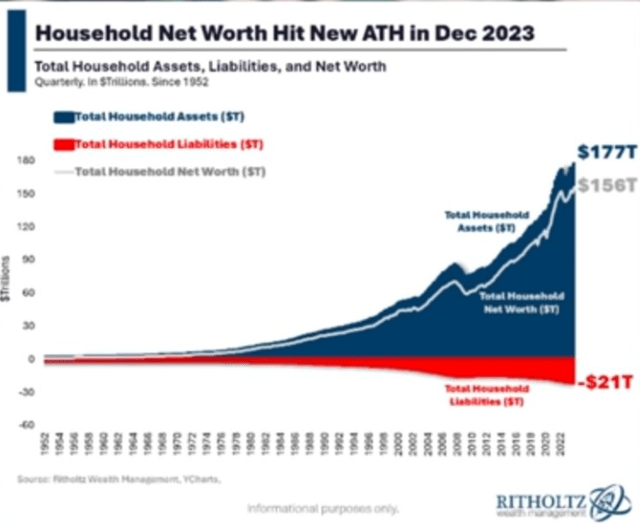
Ritholtz Wealth Management
$33 trillion in home equity and $57 trillion in stock market assets, all of which consumers can borrow against, even though rates are high.
Don’t let anyone tell you the economy should weaken so rates come down.
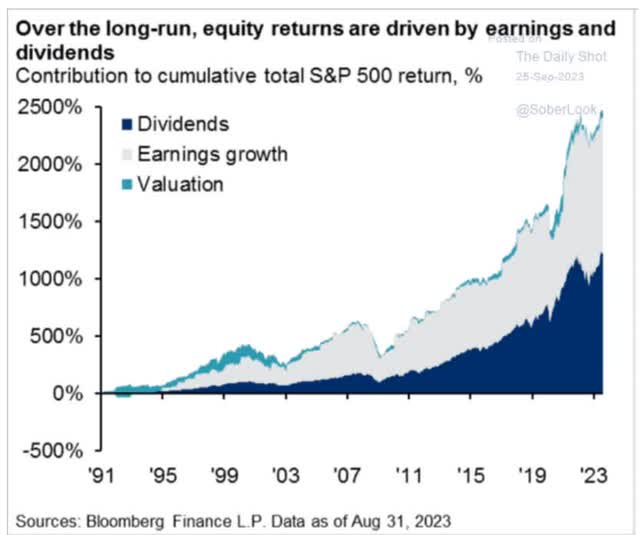
Daily Shot
Since 1991, including the tech bubble and 15 years of “free money forever,” 97% of S&P returns are explained by dividends and earnings growth.
Since 2010, 87% of market gains have been explained by fundamentals.
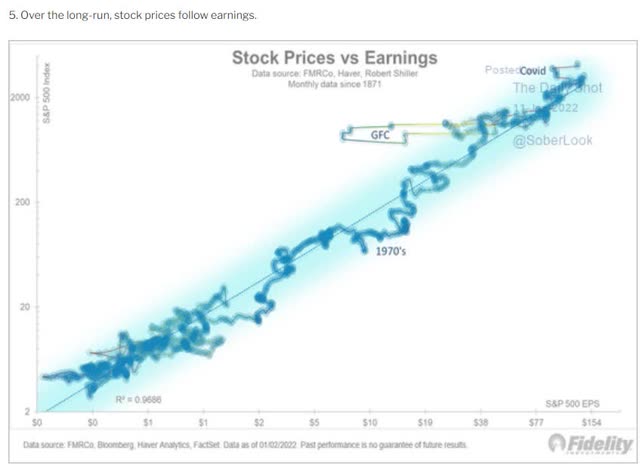
Daily Shot
Since earnings and dividends explain 1871, 97% of US stock returns.
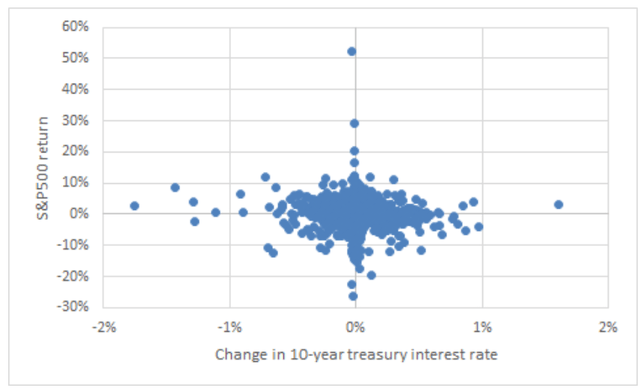
How important are interest rates? The 10-year yield is a proxy for long-term “risk-free” interest rates, which mortgage rates and corporate borrowing costs benchmark against.
Over the past 60 years there’s basically no relationship between the average level of yields and S&P 500 returns, at least at a quarterly frequency,” says Stuart Kaiser, head of equity trading strategy at Citi.” – Reuters
Paris Dauphine University
Traders care about rates; long-term investors care about earnings.
Good news is always and forever good news for long-term investors.
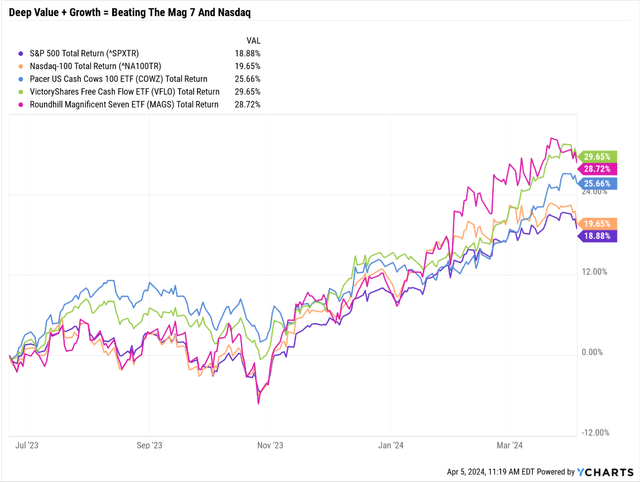
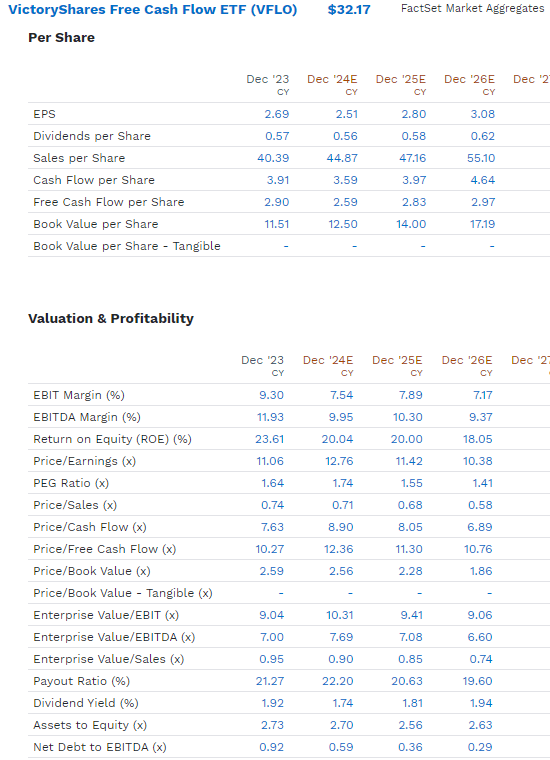
Investing Idea Of The Week: VFLO, My Favorite ETF Idea For Today’s Economic Climate And Beyond
In an accelerating economy, deep-value cyclical companies tend to do very well.
Ycharts
This week, I bought some more VictoryShares Free Cash Flow ETF (NASDAQ:VFLO) because it’s steadily proving that its deep value Buffett-style approach of deep value quality and growth is not just outperforming COWZ but also the S&P, Nasdaq, and Mag 7.
- VFLO: 5 Reasons I’m Buying This Dividend ETF For My Retirement Portfolio
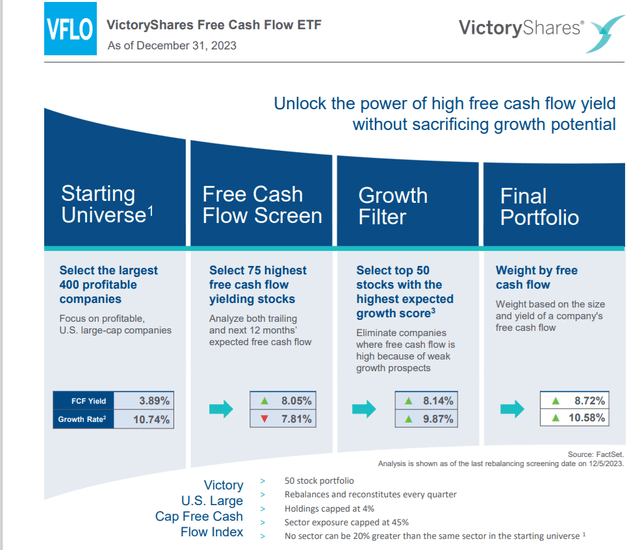
Here’s the 30-second elevator pitch for VFLO.
VictoryShares
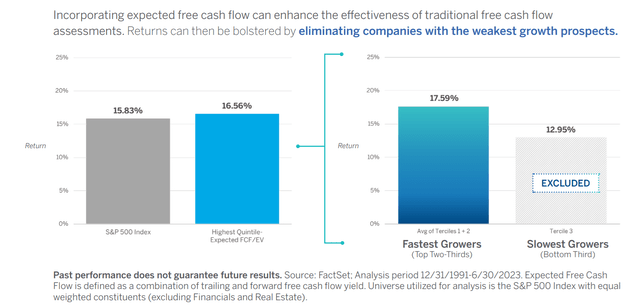
Since 1991, the strategy this ETF has been using has generated 17.6% annual returns or 151X increase in wealth, compared to the S&P’s 9.8% or 22X increase.
VictoryShares
VFLO uses a rules-based strategy to create a concentrated (though still diversified enough) portfolio of high quality, deep value with good growth.
Imagine the same growth as the S&P 400 but with a 3X better valuation. That secret sauce powered almost 18% annual returns for 33 years, resulting in over 30% since inception.
FactSet Research Terminal
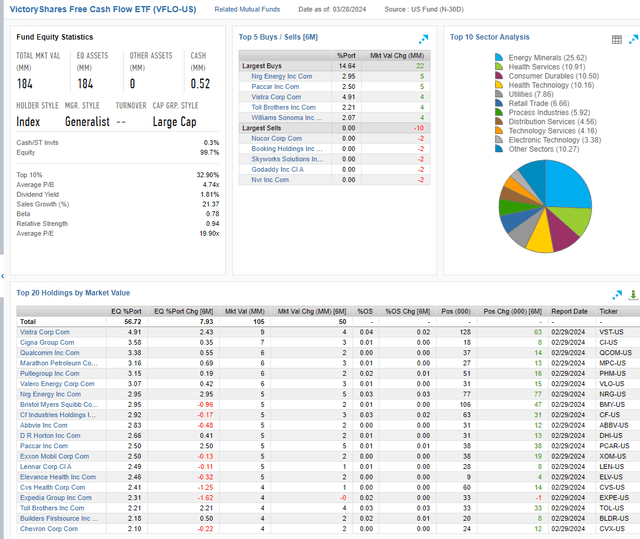
In an accelerating economy, industries, energy, and healthcare are likely to thrive, and that’s why VFLO is overweight.
FactSet Research Terminal
VFLO’s 12-month forward cash-adjusted PE (EV/EBITDA) is just over 7X, 33% less than what private equity is paying for companies.
- VFLO = 33% cheaper than Billionaires like Mark Cuban are paying for sweetheart deals.
What kind of companies are we getting? Not cigar butts, but companies with virtually no net debt, A-credit ratings (often AA-rated like XOM), and here’s the growth rate.
FactSet Research Terminal
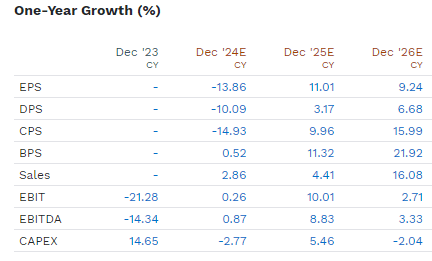
The current portfolio (turnover is almost 100% per year) is expected to see a minor EPS decline in 2024, but the S&P is forward-looking for 12 months.
Pacer Funds
So, the market is seeing double-digit growth and 7X cash-adjusted earnings, which results in a 0.7 PEG ratio, which is even better than the S&P’s 1.2.
And that’s why VLFO’s incredible first-year performance is more than 100% justified by fundamentals. There’s no bubble, momentum chasing, or FOMO (fear of missing out) here.
By definition, VFLO will own the best FCF PEG large caps, making it my favorite deep value, quality, and growth ETF right now, especially at this stage of the economic cycle.
- Mid-cyle but acceleration in industrials and energy and cyclical
Conclusion: Long-Term Investing Is Betting on The US Economy, A Bet That Is Well Supported By Today’s Evidence
Ritholtz Wealth Management
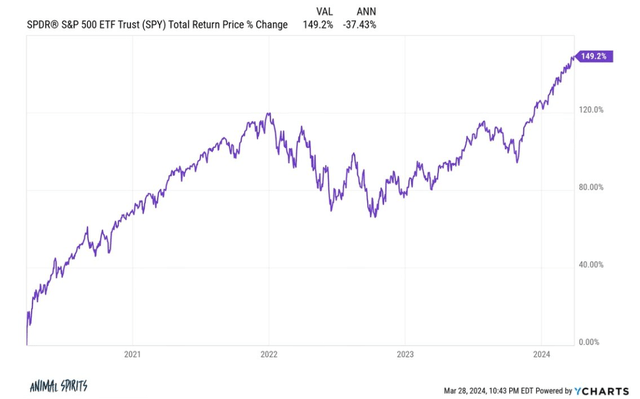
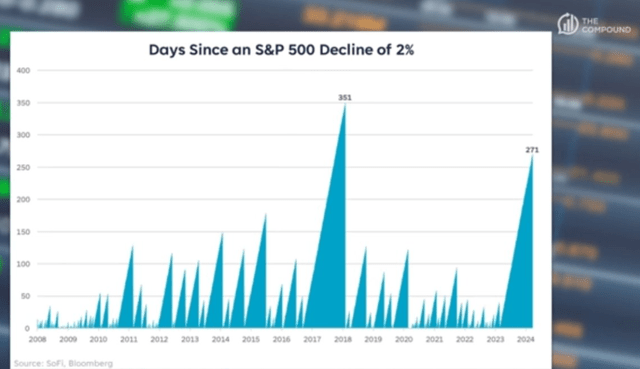
It feels eerie for the stock market to soar 10% in three months with no declines more significant than 1.8%.
It feels like 2017 when tax-cut euphoria led to a 22% stock market rally with an average VIX of 11.
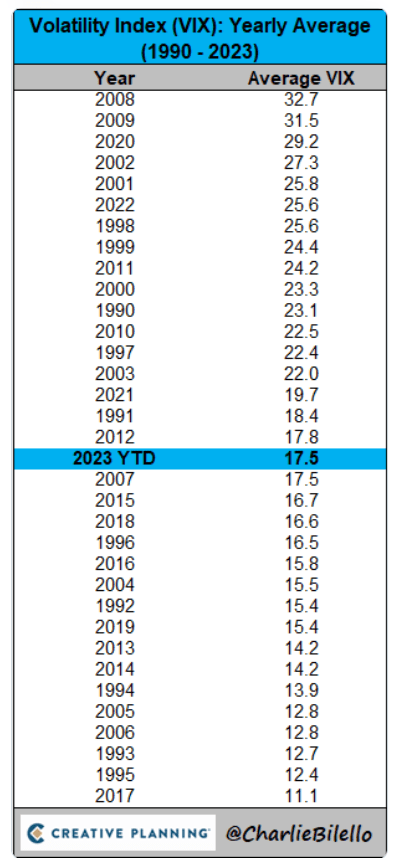
Charlie Bilello
That was the lowest volatility in 52 years.
But guess what? The market gains have been justified mainly by solid fundamentals.
The economy appears to be accelerating, with report after report beating to the upside.
Solid jobs and a strong economy are always and forever good news for stocks.
If you’re a long-term investor sticking to your personally optimized asset allocation, interest rates rising are not a concern.
Short-term traders? They’re the only ones who have to worry about interest rates. What about the rest of us?
Nobody can predict interest rates, the future direction of the economy or the stock market. Dismiss all such forecasts and concentrate on what’s actually happening to the companies in which you’ve invested.”— Peter Lynch


")


