Baris-Ozer
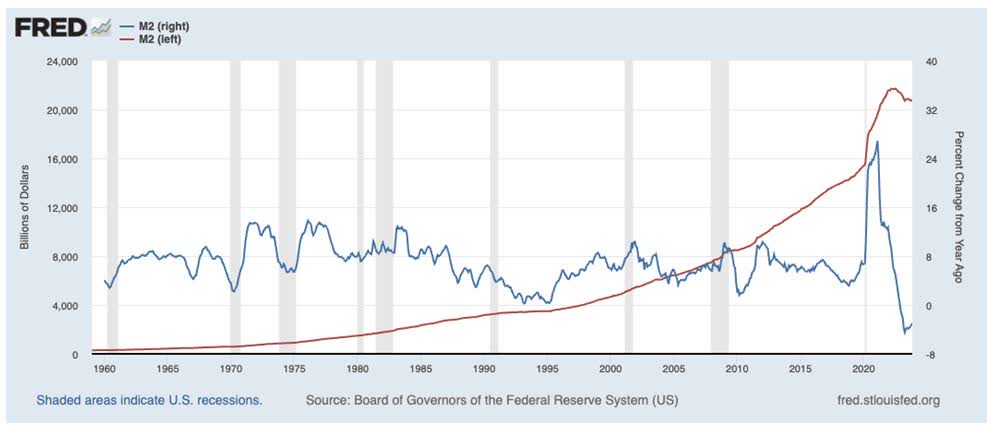
The unprecedented shrinkage in M2 money supply continues, and with it, we have seen generally falling inflation numbers. The M2 shrinkage process began in December 2022 and, as of this writing, it is still ongoing.
The latest reported numbers are for November 2023, at -2.95% on a year-over year basis. In theory, if this shrinkage continues, we could see really low inflation numbers by the middle of 2024.

Graphs are for illustrative and discussion purposes only. Please read important disclosures at the end of this commentary.
Economists used to say that money supply growth does not correlate with inflation, but to that I say that “scale matters.”
M2 had never surged by +26.9% (year-over-year), as it did from February 2000 to February 2021 (courtesy of COVID spending) and had never gone negative before December 2022.
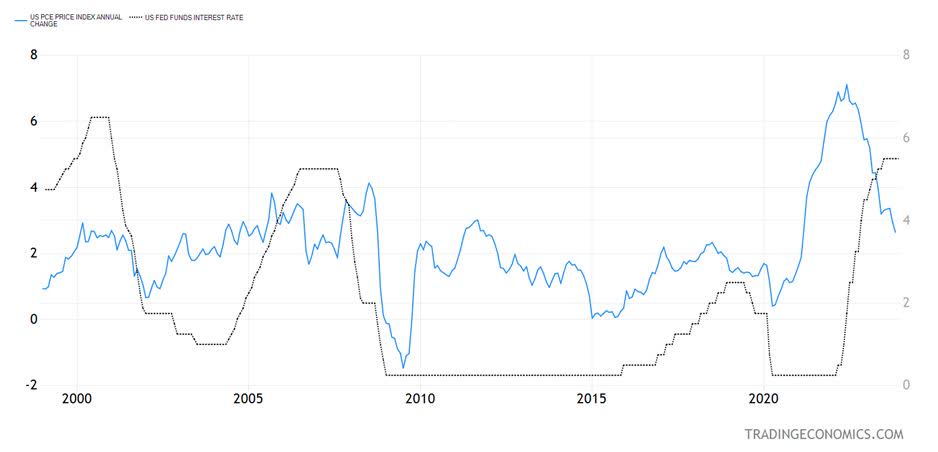
In this case, I think the huge surge and shrinkage directly affected inflation trends. Futures markets are betting that the Fed’s first interest rate cut will be in March.
I am not sure it will be that soon, but it is possible if inflation keeps falling. But by June, the Fed would have already started its rate-cutting cycle.
Three years ago, a financial journalist authoritatively told me that the Fed does not control the money supply, which I am sorry to say was completely erroneous.
The Fed directly controls the narrowest form of money supply called M0 (as in “M-zero”), also called the Monetary Base, which consists of currency in circulation and excess reserves.
As for the broader measures of money supply – M1, M2 and M3 (no longer reported in the aggregate, but whose components are still available) – the Fed does not directly control these measures, but it affects them to a great degree via interest rate policy.
In the most recent case, the 2020-21 surge in M2 came from out-of-control COVID deficit spending (coming from Congress and two administrations), which was monetized by the Fed, so the responsibility is roughly 50/50 between the fiscal and monetary authorities in the U.S.
The recent 2022-23 shrinkage is mostly due to higher interest rates and deficit spending that is less than in its out-of-control COVID times.

Graphs are for illustrative and discussion purposes only. Please read important disclosures at the end of this commentary.
We will see the Fed’s favorite PCE inflation index at the end of January. It was down to 2.6% at last count. While 3- and 6-month annualized rates of change can be very misleading, if the present trajectory of the PCE index holds, we will be under 2% inflation on that gauge by the middle of 2024.
In a sub 2% inflation environment, it would be hard for the Fed not to cut the Fed funds rate.

Graphs are for illustrative and discussion purposes only. Please read important disclosures at the end of this commentary.
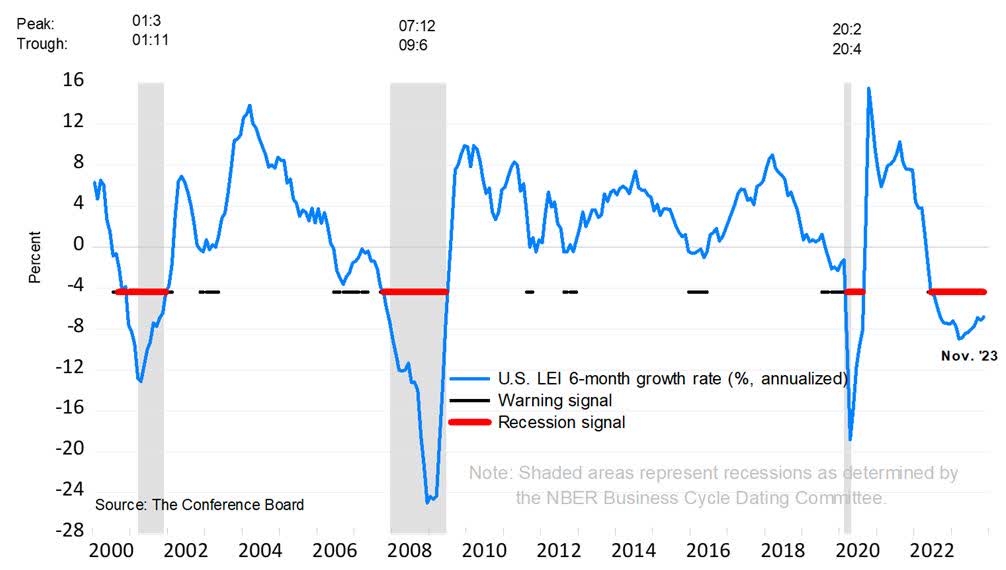
The Leading Economic Indicators, compiled by the Conference Board, have been signaling a recession for quite a while, but no recession has been forthcoming. It is possible that we completely avoid it.
This time it could become the one recession signal everyone was sure would work that simply didn’t because of really low unemployment and a really strong housing market, despite higher interest rates because of the very low inventory of homes available for sale.
We can’t be sure of the still possible lags of monetary policy that can hit the economy in 2024, but if there is no recession by mid-2024 and the Fed is cutting interest rates by then, it would be hard for a recession to happen in that environment.
All content above represents the opinion of Ivan Martchev of Navellier & Associates, Inc.
Disclaimer: Please click here for important disclosures located in the “About” section of the Navellier & Associates profile that accompany this article.
Disclosure: *Navellier may hold securities in one or more investment strategies offered to its clients.
Original Post
Editor’s Note: The summary bullets for this article were chosen by Seeking Alpha editors.


