Dilok Klaisataporn
“Assume life will be really tough, and then ask if you can handle it. If the answer is yes, you’ve won.” – Charlie Munger
It’s a new year, investors have changed the page on the calendar, and now we’ll see if they have also changed their mindset when it comes to the equity market. Contrarian investors might be prone to think that the market is likely to fall after a big up year, while momentum investors like to trade on strength. One year of positives turning into strength the next year. But if we look at the correlation between returns one year to the next, there isn’t any. What we do find however is that after huge gains there is a least a period of rest, consolidation, and perhaps a retest of a bullish investor’s will.
Following the 27% gain for the S&P in’21, the fortitude of investors was not only tested, it was in many respects completely broken. The 2022 BEAR market confused many investors and resulted in a 19% loss for the S&P. That leaves us looking at what comes next after what turned out to be another surprise – a 24% gain for the S&P 500 last year.
Sentiment and trends continue to shift as the backdrop changes, and that occurred multiple times in the last two years. 2023 started in a BEAR market and turned back into BULL mode only to be at the cusp of another major trend change in October. However, the surprises continued when the indices staged a furious Q4 rally that completely fooled and destroyed anyone who was ONLY following the fundamental picture. A technology sector that was thrown away in ’22 became the darling of Wall Street and the ONLY sector to post a profit (+57%) in that same year, was deemed uninvestable in ’23. The last three years should reinforce the point that market participants have to remain flexible to survive the mind games of the equity market.
Entering 2023 investors believed nothing could ever go right again and look at what occurred – a 24% gain for the S&P 500 with the DJIA ending the year at a new record high. As we begin this year, the investing public believes nothing can go wrong. The Fed is going to cut interest rates as quickly as they raised them, and the economy will stay resilient because it’s an election year. The belief is that no one in DC will allow the economy to fall apart before November rolls around.
I have two words for everyone – Caveat Emptor. That does not mean I enter Q1 in a Bearish mindset. The technical picture is advising me to remain fairly optimistic. I don’t know how the entire year plays out, as I simply don’t play those guessing games. What I do know is that Q1 will be another quarter where ‘selectivity’ rules. If anyone believes they are going to sit back and play the same tune they did last year, the market may have a big surprise for them.
The Week On Wall Street
2024 did not pick up where 2023 left off, but investors sure saw plenty of re-positioning by institutions on the first trading of the New Year. On Tuesday, what was HOT in ’23 was not, and what was COLD in ’23 became HOT.
The S&P 500 continued its new year’s “change of pace” on Wednesday with a 0.8% decline. The Nasdaq sold off with an even larger 1.18% drop and the Russell 2,000 was more than twice as bad with a 2.66% loss. Energy, Utilities, and Communication Services were the only sectors to post a gain.
Selling continued on Thursday with intraday trading erasing earlier gains to leave the S&P 500 down 0.34% on the day. The Nasdaq and Russell 2,000 were likewise lower. The only sectors eking out a gain were Health Care, Financials, and Industrials. Energy reversed the previous day’s gain and was the worst-performing sector moving lower in sympathy with a 0.44% decline in WTI crude oil. Treasury yields rose with the 10-year settling right below 4%, adding more selling pressure.
More volatility on Friday saw all of the early gains evaporate as the sloppy trading continued before a last-minute rally eked out modest gains for the day. But that wasn’t enough to cover the losses for the week. The NINE-week winning streak for the S&P 500, the DJIA, and the NASDAQ came to an end. After a five-week winning streak, the Russell 2000 has now put in back-to-back losing weeks. The breakout in small caps that was cheered is looking somewhat shaky.
The Economy
The construction spending report beat estimates with a 0.4% November gain after massive upward revisions. Analysts saw huge boosts for public construction and smaller hikes for nonresidential and new residential construction, though analysts saw some trimming for the home improvement residual. Construction spending looks poised for an 11% growth pace in Q4, after rates of 13.4% in Q3, 10.1% in Q2, and 12.1% in Q1.
The US manufacturing sector slipped further into contraction during December.
The S&P Global US Manufacturing Purchasing Managers’ Index posted 47.9 in December, down from 49.4 in November and lower than the earlier released ‘flash’ estimate of 48.2. The latest decline in the health of the sector was modest overall and the quickest since August.
ISM Manufacturing (www.ismworld.org/)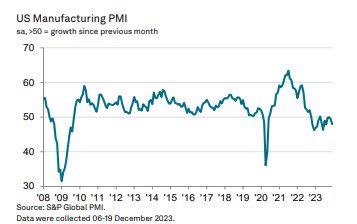
U.S. ISM December Manufacturing index rose to 47.4 from a 4-month low of 46.7 in both October and November. The reading marks the 14th straight month of contraction. Today’s ISM rise joins drops for the Empire State, Philly Fed, Richmond Fed, and Chicago PMI, but a gain for the Dallas Fed.
The final S&P Global US Services PMI Business Activity Index posted 51.4 in December, up from 50.8 in November and broadly in line with the earlier released ‘flash’ estimate of 51.3. The rate of growth in output accelerated for the third month running and was the sharpest since July. Where an increase in activity was reported, firms linked this to an improvement in demand conditions and a greater rise in new orders. The pace of expansion was only marginal, however, and slower than the series average.
US Services PMI (www.pmi.spglobal.com/Public/Release/PressReleases?language=en)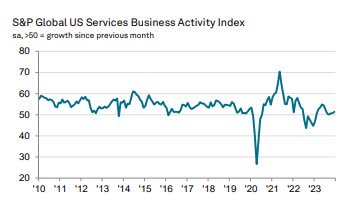
After a round of disappointing Manufacturing reports this week, we see the December ISM services index drop 2.1 points to 50.6, much weaker than forecast, after edging up 0.9 ticks to 52.7 in November. However, it remains in expansion for the 12th straight month. The bad news is that other than the pandemic low ISM services remain buried at 12-year lows. The employment component plunged 7.4 points to 43.3, the weakest since July 2020.
ISM Services (www.tradingeconomics.com/united-states/non-manufacturing-pmi)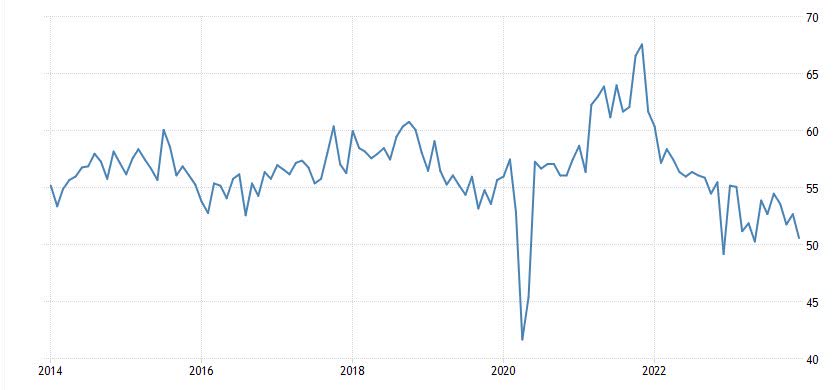
Employment
The JOLTS showed job openings slipped 62k to 8,790k in November after dropping 498k to 8,852k in October. This is the lowest since March 2021. There are 1.4 jobs available for each job seeker. Quitters declined 157k to 3,471k. The quit rate fell to 2.2% after holding unchanged at 2.3% for 4 straight months and the lowest since late 2020. The decline in quits suggests some concerns over the labor market from workers and reduced willingness to leave jobs.
December nonfarm payrolls rolled in at a much stronger 216,000. Analysts were expecting job growth to come in at 170,000.
- The unemployment rate fell to 3.5%, a decline of 0.2 percentage points and also better than the estimate.
- Wage growth was below expectations, with average hourly earnings up 4.6% from a year ago, below the 5% estimate.
- The labor force participation rate dropped back to 62.5% from 62.8% and tied last February for the weakest since January 2023.
The change in total nonfarm payroll employment for October was revised down by 45,000, from +150,000 to +105,000, and the change for November was revised down by 26,000, from +199,000 to +173,000. With these revisions, employment in October and November combined is 71,000 lower than previously reported.
Upon further investigation, the situation gets more interesting. The change in total nonfarm payroll employment for August was revised down by 62,000, from +227,000 to +165,000, and the change for September was revised down by 39,000, from +336,000 to +297,000. With these revisions, employment in August and September combined is 101,000 lower than previously reported.
The continuous downward revisions read like a shell game. Report a robust number then revise it down substantially (20% in the last 4 months) while the attention is placed on the latest release. It is no wonder that any economist has trouble figuring out what is going on with this economy.
Ironically the “private” sector ADP report has continually reported lower numbers and it is that report that has been chastised every month as misrepresenting the job scene. After the “revision shell game” that we are witnessing, it turns out the ADP report has been the more accurate depiction of the job scene.
If you want to form an opinion on whether this job report is a good sign or a bad omen for the economy, wait a month, and you will have better information to provide that answer.
The Global Scene
China PMIs: China’s Federation of Logistics and Purchasing released a PMI reading that was below 50, short of estimates, and weaker than November’s result. In contrast, the service gauge was short of estimates but rose above 50. Focusing on factories, the weakness from the “official” PMI data with that of S&P Global/Markit data was notable.
That gauge (which is collected across a wide range of the global economy on a like-for-like basis) beat estimates, rose sequentially, and came in above 50 for December. Commentary from S&P Global/Markit noted the fastest pace of new orders since February despite further declines in export orders. S&P/Global Markit also reported declines in both employment (fourth straight month) and backlog (first time in seven months) which suggests a pretty subdued demand picture.
The chart below shows the Global Manufacturing PMI data for all countries reporting S&P Global/Markit manufacturing PMI data for December so far. The average reading declined 0.5 points in December, and even excluding a large 5.2-point plunge for Myanmar (due to intensifying conflict in the country’s north) overall results still dropped. While Germany was improved, other European manufacturing results were more mixed. That includes higher beta small economies like the Czech Republic which fell sequentially amidst broad weakness despite a sequential improvement in Eurozone factory PMI
Manufacturing PMI (www.bespokepremium.com )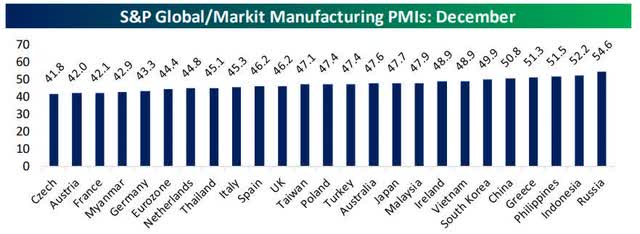
While Germany was improved, other European manufacturing results were more mixed. That includes higher beta small economies like the Czech Republic which fell sequentially amidst broad weakness despite a sequential improvement in Eurozone factory PMI
Of the 24 reports, 19 are in contraction and only 5 are in expansion territory (Above 50)
The J.P.Morgan Global Manufacturing PMI – a composite index produced by J.P.Morgan and S&P Global posted 49.0 in December, down from 49.3 in November, to remain below the neutral 50.0 mark for the sixteenth consecutive month
The J.P. Morgan Global Composite PMI Output Index, rose to 51.0 in December, up from 50.5 in November, its highest reading since last July. However, the headline index remained below its long-run average (53.2) and at a level consistent with only modest growth.
Global Services PMIs were released this week as well. Most of these gauges of activity beat estimates and rose, with China an especially notable improver. It hit a five-month high, with increased customer counts and more spending being notable trends. That said, the 12-month outlook remains weaker than the historical average.
China: 52.9 vs. 51.5 prior
Australia; 47.1 vs. 46 prior
Japan: 52 vs. 50.8 prior
Russia: 56.2 vs. 52.2 prior
UK: 53.4 vs. 50.9 prior
Eurozone: 48.8 vs. 48.7
Eurozone services activity also picked up but remained below 50. Most major Eurozone economies are seeing services activity gently improve, albeit from relatively weak levels.
FOMC Minutes
While many analysts noted that this week’s Fed Minutes contained some new information about the Federal Reserve’s plans, I have a different “take ” on what is going on. Many analysts heard what THEY wanted to hear.
Powell’s opening statement on December 13th.
“Inflation has eased from its highs, good news, but it remains too high. The policy has moved “well into restrictive territory,” with further impact still in the pipeline. The Fed remains “fully committed” to bringing inflation back to 2%. The Committee is proceeding “carefully,” he repeated. Officials still want to see further evidence inflation is coming down and admitted it will take “some time,” as seen in the SEP. And Powell said the Fed is prepared to tighten further if appropriate.
This week’s FOMC minutes;
On rates, the message of the minutes was simple: “Almost all” participants indicated cuts to come this year but “an unusually elevated degree of uncertainty” meant that “further increases in the target range” could be “appropriate”. “Several” FOMC members also warned that the Fed Funds rate may need to stay at its current level “longer than currently anticipated”.
Different wording — SAME message. In the ’24 Outlook series, I said we shouldn’t be paying a lot of attention and forming opinions on what the Fed is or isn’t going to do.
As far as I’m concerned how the market interprets the “messages” is all NOISE.
Food For Thought
The REALITY of Net Zero.
There is more change on the way and this time the supporters of the Green New Deal aren’t cheering. We’ve already seen how the EV transition is slowing as consumers have made their feelings known that the switch to electric will take a lot longer than most wanted.
The bigger embarrassment for the Green movement is starting to unfold and once again REALITY may save the day and keep global economies from committing financial suicide.
The collapse of the net-zero agenda around the world;
The European Union’s Green Deal is on the rocks, barely four years after it was unveiled to great fanfare. Key elements of the program, especially concerning land conservation, have withered on contact with the European Parliament, and enthusiasm for the rest is waning. Brussels frets it can’t keep pace with the U.S. —because Europe doesn’t have the money.
In the United Kingdom in September, Prime Minister Rishi Sunak ditched an electric-vehicle mandate that had been due to kick in by 2030. This still didn’t spare him a revolt by his own Conservative Party members of Parliament this week as more than two dozen voted against a backdoor attempt to impose on automakers a quota for sales of new EVs. The quota passed but Mr. Sunak is on notice.
Mr. Sunak’s administration also promises to issue new licenses for oil and gas drilling in the North Sea, a move that will BOOST energy independence and grow the economy. That policy is one that the opposition Labour Party seems unlikely to reverse if Labour wins an election expected next year. Labour has scaled back its green spending pledges because the party suspects voters would be wary of such a large fiscal commitment.
The Green New Deal was dealt another blow in the embarrassment that befell the movement in elections in the Netherlands last month. That vote was a rebuff of Frans Timmermans, the politician previously in charge of the EU’s Green Deal. Voters instead turned to a politician on the right, Geert Wilders, who has little time for net zero. The election may have been motivated more by immigration concerns, but voters previously had elevated a new anti-environmental-regulation farmers’ party to be the largest faction in the Parliament’s upper house as a protest against emissions restrictions in agriculture.
Germany is slipping into political disarray after a court ruling in mid-November disallowed the budget gimmick Berlin planned to use to finance its net-zero pledges. By forcing tens of billions of euros of green spending back onto the government’s balance sheet from the slush funds where politicians hoped to hide the expense, the ruling has confronted voters with the true costs of net zero. The choice now will be between social welfare and climate, and the fiscal and political math imperils Chancellor Olaf Scholz’s coalition.
The common denominator here is Reality.
European countries, like the U.S., are discovering that no matter how hard they push on the net-zero string, costs never come down, green jobs never materialize to replace industrial employment, and the subsidy bill never declines. Meanwhile, Europe’s economies are already highly efficient in carbon emitted per euro of gross domestic product—and China and India keep building coal-fired power plants anyway.
Developing economies don’t have the luxury of net-zero fantasies and understand they need fossil fuels for their people to enjoy rising prosperity. It turns out that no number of elaborate climate summits will persuade ordinary people to remain in the background as second-class citizens.
Finally, The latest example is ironically taking place at the COP28 Global Climate meeting. A draft of a potential climate deal at the COP28 summit on Monday suggested a range of measures countries could take to slash greenhouse gas emissions, but omitted the “phase out” of fossil fuels many nations have demanded. That is the lynchpin of the Green New Deal, but once again REALITY has come knocking.
Make no mistake I’m not a climate change denier. What I am is a realist. One that tries to encompass ALL of the information at hand, including cost and effectiveness. At this time no evidence suggests tackling this “issue” by throwing trillions of dollars into the mix, with no measurable results at hand, and jeopardizing the sheer balance of global economies is justified. Many are now recognizing that. Perhaps the light will finally reach the “leaders” who put the globe on this path to economic failure. The U.S. continues to march on this treacherous path with hundreds of billions allocated to green initiatives in the “Inflation Reduction Act”. Perhaps the cracks showing up in the rest of the world will turn into caverns when the US finally comes to reality they too don’t have the money, technology, and material needed to pull this transition off.
The alternative is a poor economic backdrop saddled with debt that lasts for years, and that is the train that needs to be derailed before it gets to the open drawbridge ahead.
The Daily chart of the S&P 500 (SPY)
Our first real test of the uptrend has surfaced as the S&P ran into heavy resistance when it approached the old highs and started to weaken.
S&P 500 (www.tc2000.com)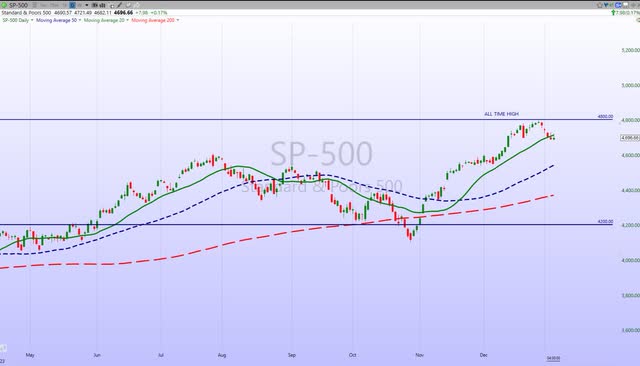
After closing within 0.30% of its record high in the last week of ’23, the S&P 500 embarked on a four-day losing streak that was broken on Friday. We got so close, and yet now those record highs seem so far away (even if we are still within 2% of that record). The fact that the S&P 500 traded at a 52-week high and then proceeded to weaken and then close below the first support levels adds some concern.
On the flip side, the uptrend remains in place. Price weakness and a period of giveback should be expected after the rally off the October lows.
Investment Backdrop
January is often a period where counter-trend situations can surface. The year starts with the previous winners being sold and the weakest stocks of last year getting some attention. A month where the overall market can weaken, but select areas of the market move higher.
One day isn’t a trend but there was a notable change in what rallied and what retreated. A hint of institutional rebalancing into “value” may keep that group strong for a while. Firms took profits in tech and put money into unloved dividend names. It’s one of the many themes mentioned in my’24 Investor Marketplace Outlook series.
A ‘Santa Claus Rally’ is a term used to describe the phenomenon where the stock market jumps in value during the last week of December and into the first two trading days of the new year. As this stock market adage proclaims;
If Santa Claus should fail to call, the BEARS may come to Broad and Wall.
With the S&P at 4746 entering this period and closing yesterday at 4704 on the second trading day of the year, there was no Santa Claus rally. Some might argue that SANTA provided a nice upside rally before the last week of December, and therefore there is no need for concern.
The Santa Claus Rally makes for interesting dialogue, but we shouldn’t be basing our strategies on this event. Of course, if you don’t believe in this phenomenon then you probably don’t believe in Santa Claus either!
Final Thoughts
This hasn’t been the easiest year. I’m probably in the minority here, but I think 2023 was more difficult than 2022. The only months that saw the S&P 500 make progress were January, June-July, and then November- December – brief but powerful periods of gains. At times (October) it looked like the primary trend was about to change once again. Otherwise, the index was either falling or recovering its prior losses.
Overall, the gains were rather strong, but it was very easy to get whipsawed, especially given the sharp reversals and frustrating false breaks of notable support/resistance. It was even tougher when we looked at the broader market, with measures such as the Russell 2000 and Value Line Geometric Index spending most of the year just going sideways. That made it difficult to have a lot of conviction in whatever market approach was taken.
Each year I attempt to learn lessons that can help improve my investment approach going forward. My main takeaway from last year is that I was able to reinforce the approach that always seems to provide the best results — WATCH the price action. Although I preach separating the short-term tactical/technical approach from the MACRO view, I found myself falling prey to paying too much attention to the poor MACRO data. That’s OK – it does keep an investor grounded, but allowing it to creep in and start to affect what is happening right in front of you is not a good idea.
So there are two takeaways for everyone here. FIRST, no matter how much experience you have in the markets, it’s a challenge to keep emotions at bay. SECOND, follow the short-term price action religiously and keep an OPEN mind. Having that flexibility allowed me to recognize the change in direction and tap into the profits that were available in Q4. A Q4 that in effect made the year for myself, my clients, and members of my service.
THANKS to all of the readers that contribute to this forum to make these articles a better experience for everyone.
These FREE articles help support the SA platform. They provide information that speaks to Both the MACRO and the short-term situation. With a diverse audience, there is no way for any author to get specific unless they’re simply highlighting ONE stock, ETF, etc. Therefore, detailed analysis, advice, and recommendations are reserved for members of my service offering on the platform.
The information provided here is verified by SA and in most cases, links are provided as supporting documentation. If anyone can point out a comment in any article I put forth and demonstrate that it is factually INCORRECT – I will REMOVE it. –
Best of Luck to Everyone!


