The phrase “flight to quality” has become omnipresent in office sector conversations over the last 18 months. It is claimed that to attract talent back to the office, firms must create an inviting space. Natural light, open floorplans, access to the outdoors, among other amenities, is a supposed necessity in a labor market that is expected to be tight for many years to come. Anecdotes of this phenomenon are abound, but how is this playing out in the data? Is there evidence of this phenomenon when we segment the data by property class?
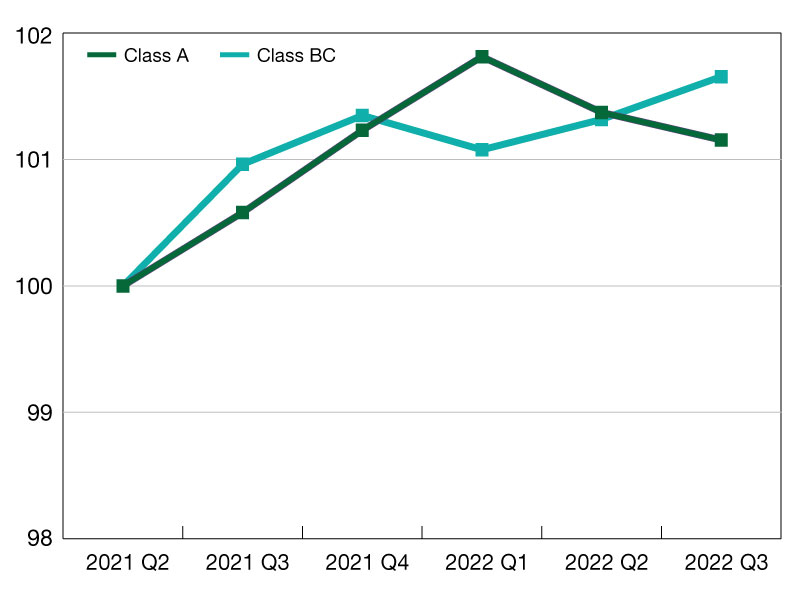
The chart below describes the trend in occupied stock for class A (Blue) and BC (Green), but segmented a second time by location. Breaking up the data between CBD (Left) and non-CBD (Right) is a key component to uncovering “flight to quality” in the data. Note how, since the second half of 2021, there is a clear divergence in fortunes in CBD submarkets, but relative consistency in Non-CBD submarkets. The situation is similar for rent changes. In this same time period, Class A rents have grown (+2.1 percent) in CBDs while Class BC rents have fallen slightly (-0.3 percent). In non-CBD locations there is very little difference in rent performance.
CBD Occupied Stock Index
Source: Moodys Analytics
Non-CBD Occupied Stock

Source: Moodys Analytics
Thomas LaSalvia is director of Economic Research, Moody’s Analytics.


