

PixelsEffect
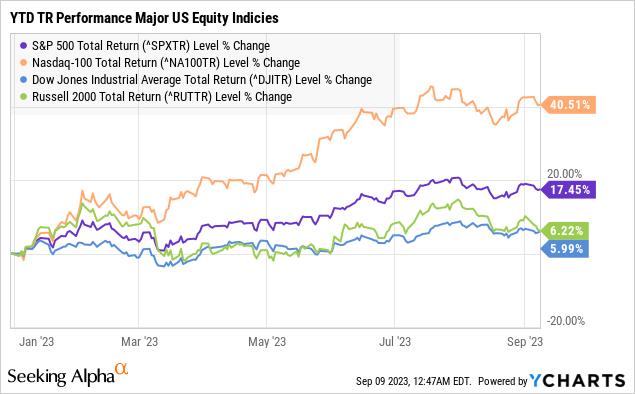
It’s been an excellent year for stock market investors with the S&P 500 (SP500) returning more than 17% thus far and nearly 30% higher from the 2022 lows. The combination of a resilient economy, easing inflation, and strong corporate earnings surprised a lot of very smart people from this time last year. We’ve been bullish during this run and can make the case that there is more upside ahead.
At the same time, it’s the perma-bears that have been caught flat-footed on the wrong side of the narrative. We can look back at several “bear traps” in recent months, where the market was able to climb over the proverbial wall of worry in 2023. Talking points that appeared to signal the start of a big market correction didn’t pan out.
We bring this up because we have another one of those big moments coming up. The August CPI report, set to be released on September 13th, will help set the market tone in the market for the rest of the year with implications for the next steps in Fed policy.
Our call is that a favorable inflation reading, particularly on the core side, should be enough to keep the Fed on hold and shut the door on further rate hikes. The setup here is for stocks to regain momentum from the recent dip and ultimately reclaim the recent highs.
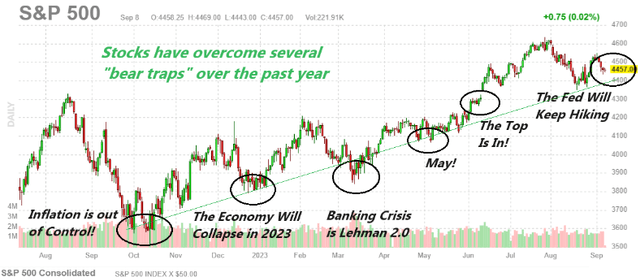
source: Finviz
August 2023 CPI Report Preview
When we talk about the “soft landing” in the economy, our interpretation of that is the Fed’s ability to bring down the CPI toward the 2.0% target, without wrecking the economy. What we’ve seen is that following a string of 11 rate hikes since early 2022 taking the Fed funds rate from zero to 5.5%, is that the strategy is working.
The last reported July inflation rate at 3.2% is a night and day difference compared to conditions at the cycle peak last year when the CPI hit 9.1%. The headline rate has benefited from sharply lower energy prices over the period while pressures from other categories like food have also settled. We should get more evidence of that with this update.
Ignore the uptick in the August headline CPI annual rate
- For the August CPI, the current consensus is for a tick higher in the headline annual rate to 3.6%, compared to 3.2% in July.
Our take here is that this should be interpreted as monthly variability and not indicative of a real change in trend. A recent rebound in energy off the lows is part of that dynamic, but not necessarily concerning right now.
It’s clear to us that even with a CPI of 3.6%, inflation is no longer a “problem” and the Fed has already done enough. There is still a path here for the CPI to stabilize lower into 2024. There is also the possibility this figure comes in below expectations.
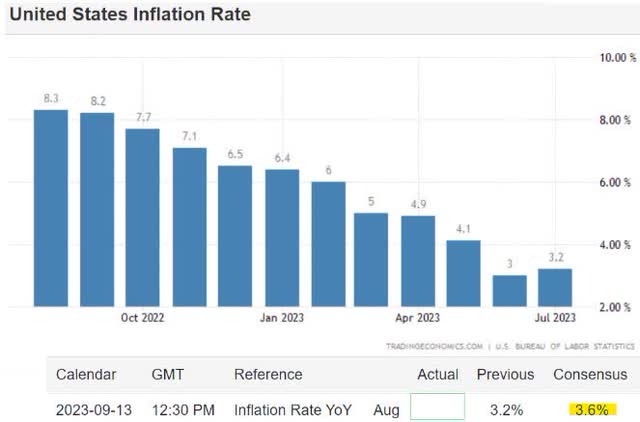
source: tradingeconomics
Naturally, we expect market bears to run circles around this figure as evidence Fed is losing control and will need to continue hiking, but that would be a mistake as it misses the bigger picture.
Drop in Core-CPI is the Bullish Development:
- From 4.7% in July, the current market estimate is for the core CPI in August to fall to 4.3%.
Here the setup with the core-CPI, which excludes food and energy, is more favorable because components on that side of the consumer price basket have been seen as “sticky” or stubbornly high all year and are finally making a bigger move lower.
We expect a positive market reaction to the core CPI reaching its lowest level since 2021 since this is the trend the Fed will be paying more attention to, especially at this stage in the cycle. The transmission of the tightening done over the past year is ongoing.
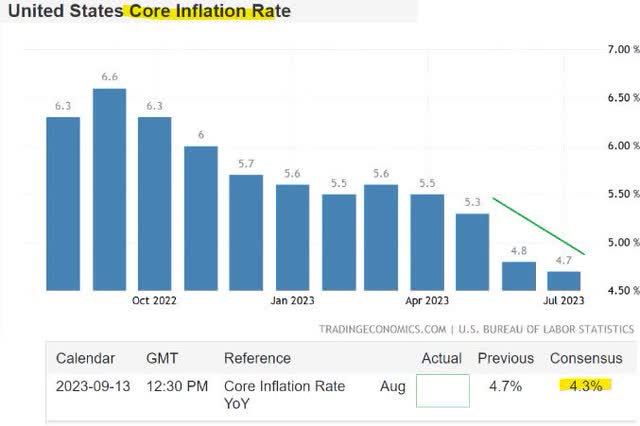
source: tradingeconomics
Falling Shelter Prices Yet To be Captured in BLS Data
The reason we are confident that core will continue to trend lower is by observing an apparent divergence between private market “real-time” benchmarks against the official Bureau of Labor Statistics (BLS) CPI data. While many indicators suggest home prices and rents have peaked, BLS has lagged based on its measurement periods and survey collection methodology.
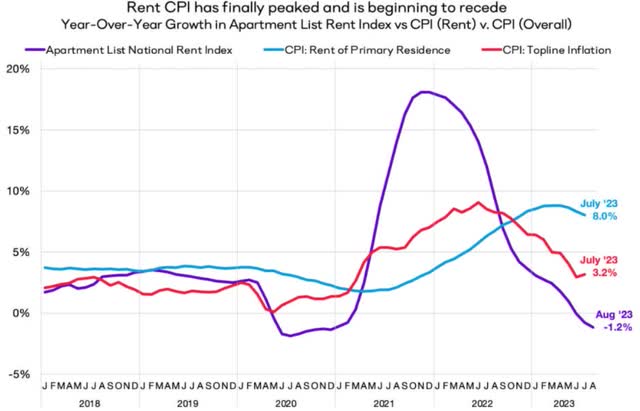
As that converges lower going forward, one of the most stubborn and elevated components of the CPI shelter which climbed by 7.7% in July should correct and drag lower the entire index. This would also help balance any volatility in energy prices.
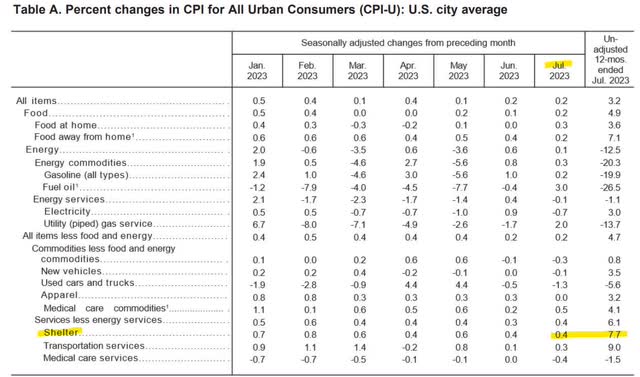
source: BLS
Industry data from “Apartment List” shows that the national rent index in August contracted for the first time since 2020, falling by -1.2% y/y. The same report also shows that 72 of the top 100 major cities in the U.S. are presenting negative year-over-year rent growth, with a climbing number suggesting more downside for the index level going forward.
Affordability is low, consumer spending is pressured, which means there isn’t much of a reason to see why rents and other core categories’ prices are suddenly going to reverse higher.
source: Apartment List
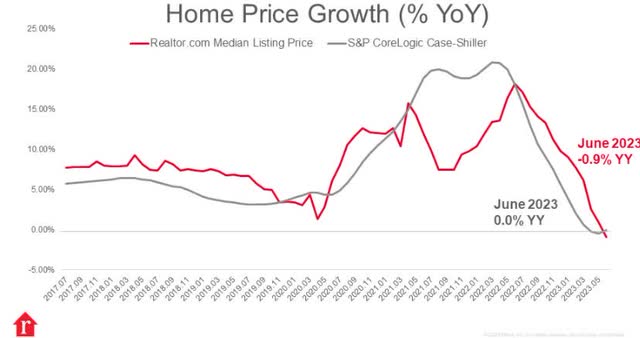
In terms of home sales, the trends are also encouraging with price growth turning flat according to the S&P CoreLogic Case-Shiller Index in June and even slightly negative on an annual basis with data from Realtor.com.
Again, these drops are in sharp contrast with the 7.7% increase in shelter prices seen in the July CPI data. We expect the August report to begin better reflecting these current market conditions.
source: Realtor .com
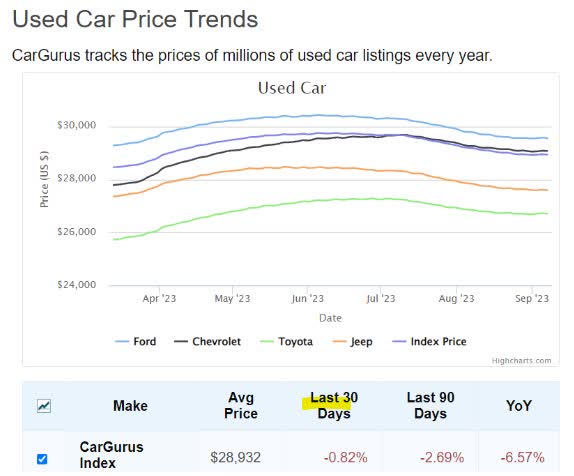
That’s also the case in the used car market, where we like to follow the “CarGurus Index” which shows the average price of used cars is down by -0.8% just over the last 30 days, and -7% over the past year. This index is good because it tracks millions of listings buyers are seeing right now.
This is one segment that remains skewed going back to pandemic supply shortages and production stoppages. As new car inventories build, combined with the impact of high loan rates and consumers already under pressure, vehicle prices within the CPI are one area we have a further downside.
source: cargurus
Oil Price Rally Not Yet Concerning
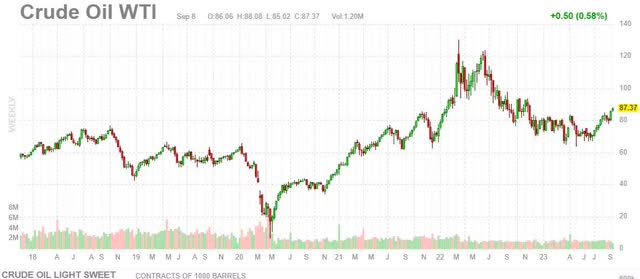
What has raised some eyebrows is the ongoing rally in the price of oil, with WTI crude (USO) currently around $87/bbl, up from as low as $67/bbl in June. Naturally, some of that should be captured in the energy component of the CPI for August, even as the annual trend remains negative.
In our view, oil only becomes a cause for concern above ~$100/bbl as a level that could kickstart a new round of cost-pull inflationary trends, and we’re not there yet. The current national average for the price of gasoline at $3.80, is well below the peak in 2022 when ran above $5.00 a gallon.
Conditions last year that took the price of oil briefly above $130/bbl were unique as they were driven by global supply chain disruptions and even the initial uncertainty of the Russia-Ukraine war. We’re just not seeing the supply crunch necessary for oil or gasoline to make that type right now.
So while oil can still rally a bit higher from here, it’s not quite a game-changer in terms of its implications for the CPI, especially this upcoming August report. The way we see it is that the Fed is more concerned about the aspects of inflation it can control with core indicators taking precedence at this stage in the cycle.
source: finviz
What about the Fed?
Outside of a spectacular surprise higher to the CPI data coming in hot, the overwhelming consensus is that the Fed will keep rates steady at the next FOMC set for September 20th. The recent August payrolls report showed an uptick in the unemployment rate along with messaging from Fed officials suggesting they are content to wait it out and absorb a few more months of data.
On the other hand, the question becomes more interesting looking out to the end of the year, where the market is nearly split on where the Fed Funds rate will be set at the December meeting.
According to the current market implied probabilities based on Fed Funds rate futures, there is a 53% chance the Fed will hold at the current rate through year-end, compared to a 45% chance of a hike. We’re in the hold camp.
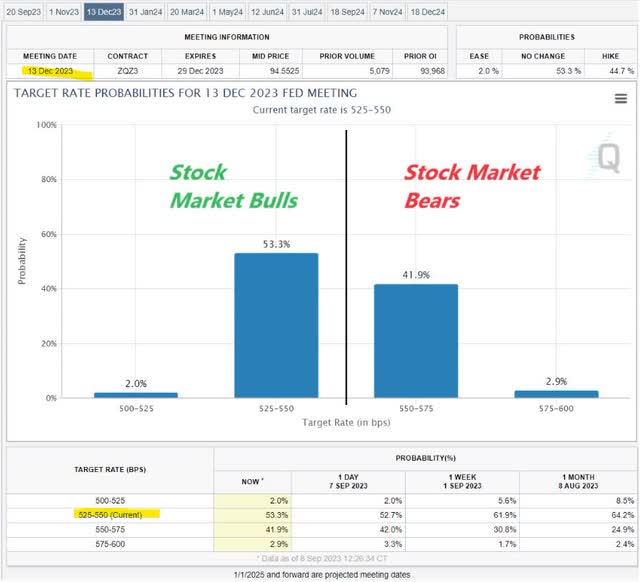
source: CME FedWatch Tool
The call we have is that the Fed is done, and further hikes are unnecessary for the CPI to continue trending lower. The Fed has said it is data-dependent, and the good news here is that the data on the inflation side has turned out well. This scenario should be positive for the stock market, especially if it is accompanied by continued resiliency in the economy as we have seen all year.
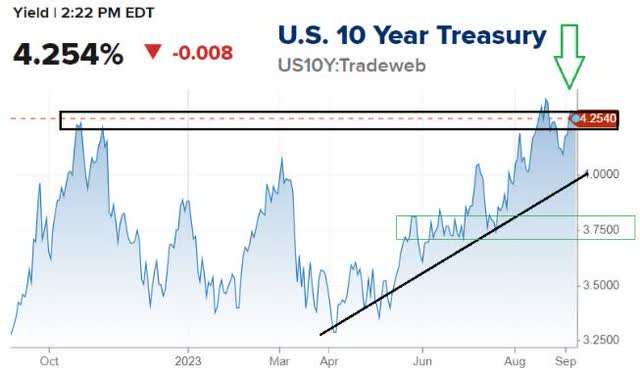
The way to see it playing out is that greater market confidence that the Fed is done hiking because the CPI is trending lower through the end of the year, should work to push market rates and bond yields lower.
Looking at the 10-year Treasury as a benchmark, room for the yield to pull back towards 3.75% as our year-end target would also allow the U.S. Dollar to weaken as a backdrop of more positive risk sentiment. As a side note, we see value in long-term bonds overall.
The other side to the discussion is the bearish case, where the inflationary outlook deteriorates and inflation expectations climb higher for any number of reasons. This could force the Fed to resume hiking and turn more hawkish, creating a new round of volatility in bonds and stocks as the key risk to consider.
By this measure, market bears are sort of betting on the CPI and core-CPI to come in hotter than expected, as a catalyst for the market to reset expectations lower.
source: CNBC
What about Stocks?
We remain bullish on stocks and see the following factors as driving further upside through year-end.
- Easing inflation through a falling core CPI.
- Stability in rates as the FED stays on hold, with room for rate cuts in 2024.
- Resilient economic indicators between a stable labor market and modest economic growth, brushing aside fears of a recession.
- Continued corporate earnings momentum getting into the Q3 reporting season next month.
- Revisions are higher to earnings estimates into next year.
Final Thoughts
We mentioned the bear trap at the start of the article. In this case, anyone expecting a big selloff just because the annual headline CPI rate ticks higher in the August report may find themselves disappointed. We expect the trends in the core CPI to steal the show, which should be enough to keep the Fed from hiking at the next FOMC as a more bullish development.
The Fed has said several times they are data-dependent, and that’s good news for the stock market as it relates to the indicators that matter. With some of the major U.S. equity indexes off a few percentage points from their highs, the call here is to buy the dip into the August CPI report.


")


