

Sky_Blue
When publishing the Ward Three Wave Theory primarily I wanted to both attempt to put an answer to a myth and help people understand how a financial market gets from one price region to another. Because supposedly a Japanese rice trader named Munehisa Honma had devised a system using candle sticks that enabled him to identify future demand for rice in the 17th century.
I wrote a piece about oil a number of months ago for a commodities trading publication that questioned how exactly did Mr Honma develop a method using candlesticks to identify high probability in the future of the price of rice, canceling all buying in one area and moving onto the next region.
This is a question no one seems to ask as the financial world stares at candlesticks gyrating around a screen on a daily basis. Candlestick patterns are supposedly a way of predicting the future of price, with books and list of all the different names on the topic available for our reading.
Do we really think Mr Honma could get an exact reading of the future price of rice from an abandoned baby? Perhaps he could, maybe he was that good.
The Elliott wave theory has actually identified the answer within its remit before it continues in complexity, with people using the theory often providing several different scenarios of where a market may land before claiming the call if one of them hits.
When I look at a chart, my primary concern is where the highest probability lies of what a financial market will do (exactly) and wonder what Mr Honma would make of my written take.
If we go back to the original Tesla (NASDAQ:TSLA) piece I wrote for Seeking Alpha as an example, it claims that Tesla is in a bearish three wave pattern, which is due to land at $176 should wave one numerically copy wave three. As it turns out, Tesla has so far delved into the $200 region, but on the back of a stock split.
Tesla Former monthly pattern (C Trader )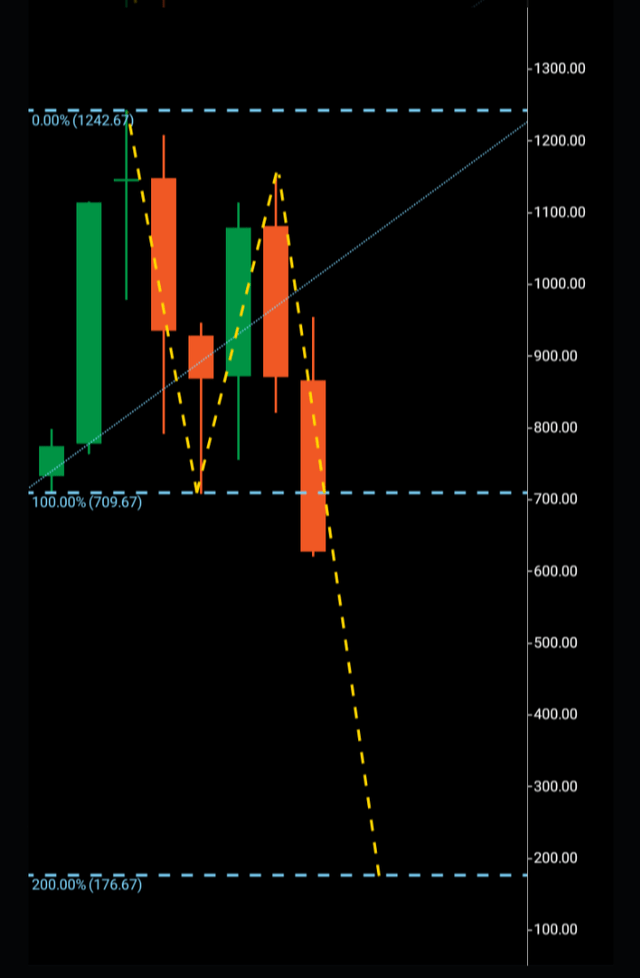
You see, a financial market cannot move significantly higher or lower without making what has been termed (waves) in price. A wave one is a high or low that carries price a certain length until it exhausts. A wave two then must stay within the parameters of the wave one, certainly in a bullish case not exceeding the bottom and bearish case not exceeding the top. The wave two must form what is called a rejection, which in bullish form must be a bearish candle and bearish form must be a bullish candle as we can see above on the Tesla monthly chart before the stock split.
It is when this rejection candlestick is printed, it paves the way for what is known as the third wave to break above or below waves one and two and carry price onto the next region, shutting the door on the previous price area.
So we have identified our point of entry as the point where the third wave breaks out, but how do we gauge where exactly this new price has the highest probability of landing? I put the case forward that if a wave one can carry from one price range to another, then when the rejection has been formed and beaten, the third wave will look to print the exact same number before it possibly finds its rejection. It may of course continue further, but we do not have any printed evidence of that, other than to wait for the market to form an additional three wave pattern in the same direction once the third wave has numerically replicated wave one.
Since Tesla’s stock split in August, the fact remains it is impossible to gain a reading from the monthly chart, so we are forced to move to the weekly chart to try and identify any wave patterns.
Tesla current weekly chart (C Trader )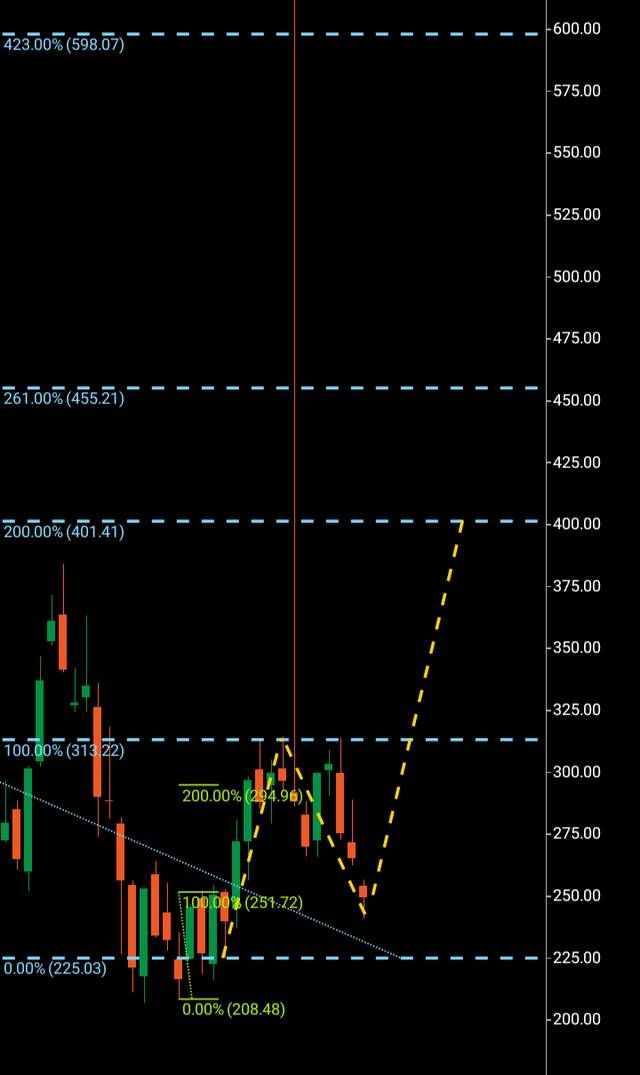
Firstly we can see in the chart above that Tesla had actually printed a miniature three wave pattern highlighted by the green Fibonacci, which has seen its third wave target hit before continuing slightly further and dropping back into the structure.
So it is now $225-$312:which we will look to as an additional wave one, with the former being the most recent bottom.
A protracted wave two has seen price retrace to the initial breakout area from the miniature third wave, a financial market will virtually always retrace to a breakout area and this is another reason I have written the Three Wave Theory as often a third wave will hit it’s outlined target before retracing to the breakout area before making its next decision. We do not have crystal ball for its next decision, hence why we take the entry and exit provided by the printed three wave pattern.
If Tesla can hold above $208 and then break above $313, we can see the technical target for this third wave lies at $401. We can also see the Fibonacci 261 and 423, but for now this is simply a numerical outline.
Tesla can of course go lower, and it is not within the realm of possibility that price can achieve $176 from its original bearish macro third wave target.
But staying above $208 and breaking out over $313 will certainly lend to higher probability that Tesla had bottomed as we await a reading from the coming monthly candles. If Tesla does breakout above $313 it can get to the $400 region with 30-60 days and am labeling this article a technical hold until it does so.


")


