

RiverNorthPhotography
T. Rowe Price Group (NASDAQ:TROW) has seen a sharp decline in its stock price with being down almost 50% from the high in late 2021.
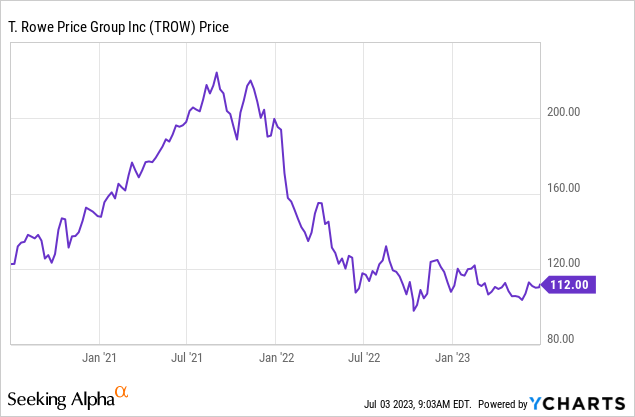
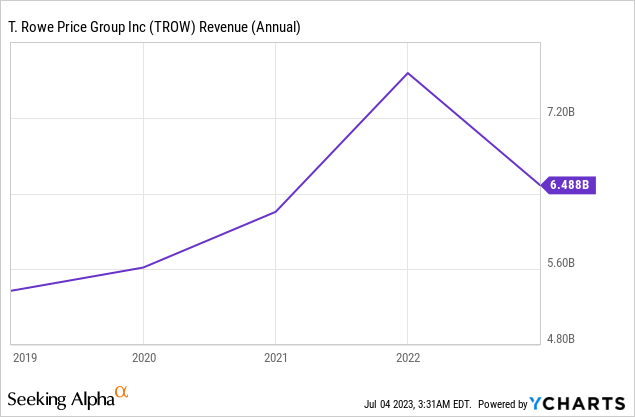
This decline can be mainly explained by the decline of TROW’s Assets Under Management, which in turn leads to a decrease in fees and thus in revenue for TROW.
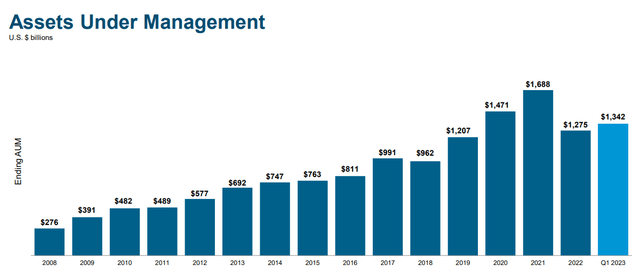
AUM of TROW (troweprice.gcs-web.com)
As can be seen the AUM certainly declined. But in my opinion, the decline from $1,688 billion in 2021 to $1,342 billion in Q1 2023 – a decline of 20% – doesn’t justify the 50% drop in stock price.
In this article, I will shortly summarize the main points that are currently important for TROW via a SWOT-Analysis and will afterwards try to give a suitable price target for TROW, comparing it with peers and using two Discounted Cash Flow Analysis.
SWOT Analysis
Strengths
Established Brand and Trust: T. Rowe Price Group has a long history of offering high-quality financial services. With over 80 years of experience, they have developed a strong brand image and earned the trust of investors.
Diverse Range of Services: The organization provides a wide range of financial alternatives, including mutual funds, retirement plans, and consulting services. This not only draws a diverse range of customers, but also enables them to cross-sell products and services.
Experienced Management Team: T. Rowe Price’s seasoned management team is a key advantage, having a demonstrated track record in financial planning and decision-making. Their significant industry knowledge enables them to understand market trends and manage risks effectively.
Strong Financial Performance: T. Rowe Price has a track record of outstanding financial performance and continuous expansion in assets under management (AUM). Their financial stability attracts new investors and gives existing customers confidence.
Weaknesses
Reliance on Market Performance: T. Rowe Price’s success is heavily influenced by market conditions. During instances of financial market turmoil, their revenues and profitability may suffer.
Regulatory Compliance Risks: TROW in a highly regulated industry and is always subject to regulatory changes. Noncompliance might result in serious sanctions and damage to their reputation.
Limited Physical Presence: TROW physical presence is primarily centered in the United States, which may hinder its capacity to deliver localized services to overseas clients.
Operational Risk: T. Rowe Price, like any other financial institution, is vulnerable to operational risks such as system failures or cyberattacks, which could interrupt corporate operations and result in financial loss.
Opportunities
Emergence of Digital Platforms: T. Rowe Price sees new potential as the popularity of online investment platforms grows. Investing in technology to improve digital offerings can help companies attract more tech-savvy investors.
Growing Demand for Retirement Solutions: The demand for retirement planning and investing solutions is predicted to rise as the population ages. T. Rowe Price now has a tremendous possibility for expansion.
Sustainable and ESG Investing: Investors are increasingly selecting companies with excellent ESG (Environmental, Social, and Governance) standards. T. Rowe Price can benefit from this trend by providing more ESG-focused goods.
Threats
Intense Competition: With multiple large competitors, the financial services market is very competitive. New entrants, particularly those based in technology, have the potential to disrupt the market and decrease T. Rowe Price’s market share.
Economic Instability: Economic downturns or financial crises can have a substantial impact on investment behavior, resulting in lower AUM and a reduction in T. Rowe Price’s revenues.
Regulatory Changes: The financial sector’s ever-changing regulatory framework could represent a big danger. New or amended regulations may raise operational expenses and have an impact on business practices.
Technological Disruption: Rapid advances in fintech and the rise of robo-advisors have the potential to disrupt traditional asset management services, potentially affecting TROW’s company.
Valuation
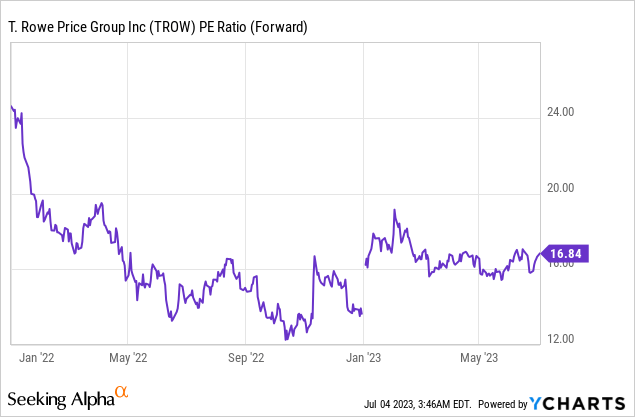
Looking at the current PE Ratio of TROW, the company certainly looks expensive, with the average PE of the last ten years being at 16 and the company trading at 18.5.
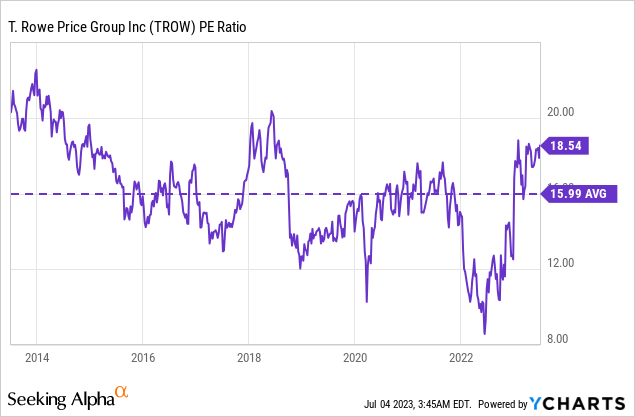
However with the Forward PE being at 16.8 things don’t look that bad anymore. One could argue that the decline in AUM and revenues is therefore already priced in.
Seeking Alpha currently gives TROW a Valuation Grade of “D+”. However, I think that the comparison with the general Financials sector, that SA is doing isn’t useful.
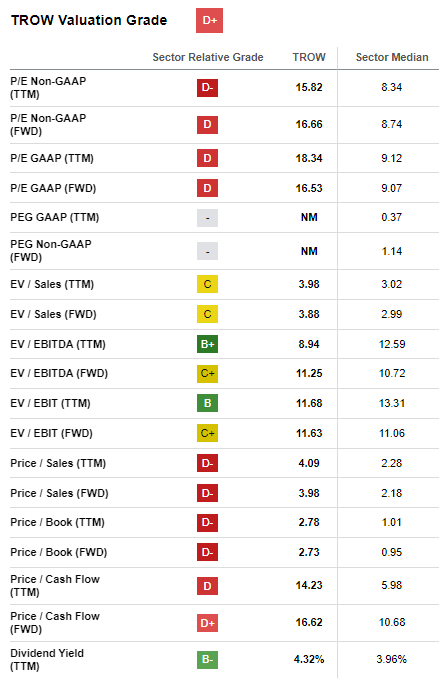
TROW Valuation SA-Grade (seekingalpha.com)
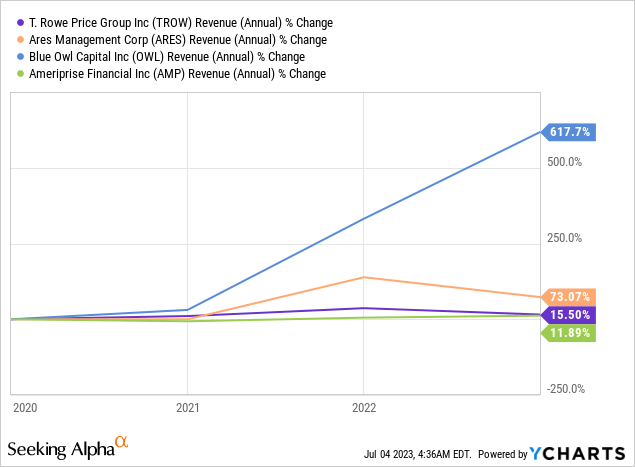
It’s hard to find peers of TROW that completely align with the business of TROW. After research I decided to go with Ares Management Corporation (ARES), Blue Owl Capital Inc. (OWL) and Ameriprise Financial, Inc. (AMP).
I’m aware that these companies can’t be compared 100%, but I think it still gives us a nice understanding of TROW’s current positioning within its peer group.
When looking at the EV / EBIT of the last 12 months we see that TROW seems attractively valued compared to ARES and OWL, but it seems expensive when compared to AMP.
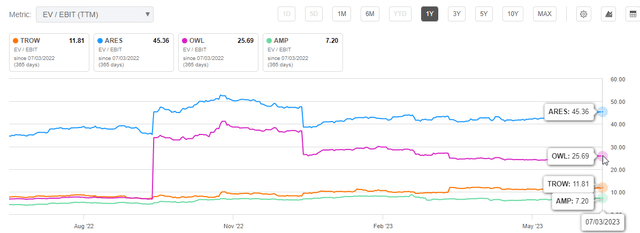
EV / EBIT peer group comparison (seekingalpha.com)
We get a similar picture, when looking at the EV / Sales of the last twelve months.
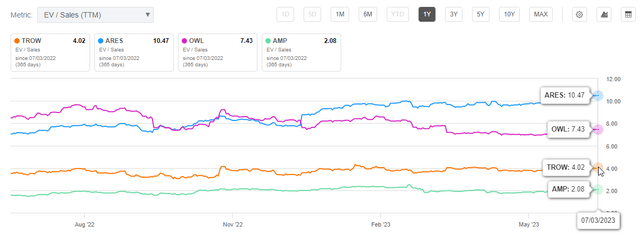
EV / sales peer group comparison (seekingalpha.com)
To put things into perspective, the companies ARES and OWL, have been growing more rapidly than their two counter parts TROW and AMP, which in turn means the companies deserve to trade at a premium compared to those counter parts.
When comparing AMP to TROW, paying a slight premium for TROW, is in my opinion, more than justified, more so when we take into account the different growth rates of the companies in the last few years.
| 10y CAGRs | TROW | AMP |
Revenue | 7.07% | 3.44% |
EBITDA | 6.18% | 4.77% |
Total Assets | 10.18% | 1.96% |
Levered Free Cash Flow | 7.06% | -2.35% |
Data: seekingalpha.com
Keep in mind, the comparisons above only consider past performance and therefore compare TROW’s current “low” level of revenue and EBIT. Considering past performance, TROW currently seems reasonably valued within its peer group.
As we all know, the stock market however tends to look into the future, therefore I conducted two different Discounted Cash Flow Analyses, that take the future predictions for T. Rowe into account.
One predicts that T. Rowe grows like analysts predict and one anticipates that TROW’s AUM and therefore their revenue stays flat until 2030. Blue cells are the main projections I took. Here are the major points and assumptions summarized:
Revenue: Like mentioned above, I anticipated that the company’s revenue behaves like the analysts predict right now.
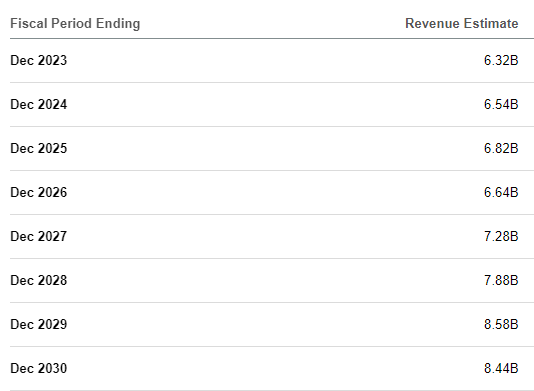
Revenue Estimates (seekingalpha.com/symbol/TROW/earnings/estimates)
EBIT Margin: For the EBIT margin, I averaged out the last three years and used 44% for the next 7 years to calculate the company’s EBIT.
Financial Result And Taxes: Using an average of the last three years, I applied -23% to calculate the Net Profit for 2023 through 2030.
Tax Rate: The tax rate used for this DCF is 23%, also aligning with the average of the last three years.
Free Cash Flow: From there on, I calculated the EBIAT using the given tax rate and then attempted to apply a fitting EBIAT to FCF ratio. Here the average of the last three years – 2% – seemed reasonable.
WACC: As per Finbox, TROW’s WACC is currently at 11%.
Perpetuity Growth Rate: The perpetuity growth rate assumed for the analysis is 3%.
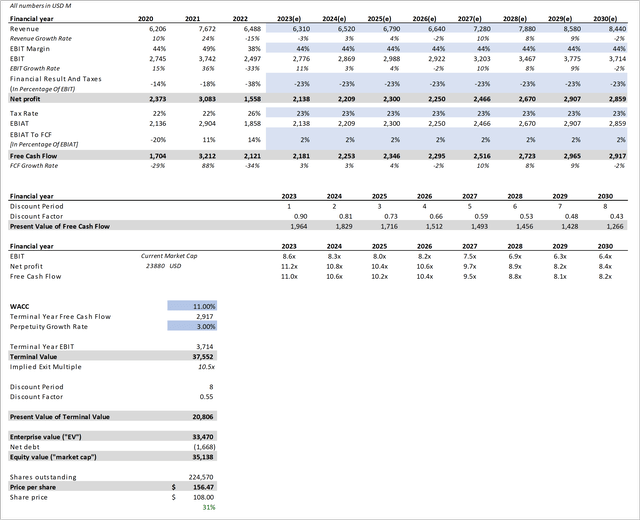
DCF for TROW (seekingalpa.com; troweprice.gcs-web.com)
With this “Bull-Case” we arrive at a price target of $156, which indicates that the company is possibly undervalued by ~30% right now, considering that the company’s fundamentals behave like anticipated by the analysts.
Like mentioned above our second DCF will now anticipate that TROW’s AUM and therefore their revenue stays flat until 2030. Other metrics stay the same.

DCF for TROW (BEAR) (seekingalpa.com; troweprice.gcs-web.com)
Based on this assumption, we get a price target for T. Rowe of $130. So even when expecting no growth for the next seven years, the company appears to be undervalued by ~15%.
Conclusion
Considering these factors, my current rating for T. Rowe Price Group stock is a “Buy”. The scenario of no growth for the next 7 years is the “worst case” scenario in my opinion and therefore pretty much resembles my personal downside. However there is a chance of a way worse outcome possible, of course. Especially if one of the Threats and Weaknesses mentioned above impact T. Rowe’s business.
Based on this I also recently expanded my existing position in T. Rowe Price Group.
")


