

DKosig
In this analysis of Synaptics Incorporated (NASDAQ:SYNA), we examined why the company’s profitability rebounded from 2018 to 2023, with its gross margins rising from 29.5% to 59.8% and its net margins increasing from -7.6% in 2018 to 14.8% in 2022. While net margins slipped to 5.4% in 2023, this is a significant improvement following the decline in its margins from 2014 to 2018. Thus, we determine whether the company could stage a turnaround.
Firstly, we analyzed the company’s business based on its revenue breakdown and its growth to identify its key segments. Moreover, we analyze the company’s earnings and margins to determine if the rise of its IoT segment had benefited its margins. Finally, we analyzed the company’s IoT segment’s products including its market positioning to determine its growth outlook.
Company Shifted Focus to IoT Segment
In the table below, we compiled the company’s revenue by segment in the past 9 years and analyzed its growth.
Revenue Breakdown ($ mln) | 2015 | 2016 | 2017 | 2018 | 2019 | 2020 | 2021 | 2022 | 2023 | Average |
IoT product applications | – | – | – | 352 | 313 | 318 | 613 | 1,101 | 946 | |
Growth % | – | – | – | – | -10.9% | 1.4% | 93.0% | 79.6% | -14.1% | 29.8% |
% of Total Revenue | – | – | – | 21.6% | 21.3% | 23.8% | 45.8% | 63.3% | 69.9% | |
PC product applications | 260.9 | 207.4 | 229.2 | 258 | 259 | 317 | 355 | 343 | 217 | |
Growth % | 1.24% | -20.51% | 10.51% | 12.48% | 0.4% | 22.6% | 11.8% | -3.3% | -36.7% | -0.2% |
% of Total Revenue | 15.32% | 12.44% | 13.34% | 15.81% | 17.59% | 23.79% | 26.48% | 19.72% | 16.03% | |
Mobile product applications | 1,442 | 1,460 | 1,489 | 1,021 | 900 | 699 | 372 | 296 | 191 | |
Growth % | 109.06% | 1.21% | 2.02% | -31.43% | -11.8% | -22.4% | -46.8% | -20.5% | -35.4% | -6.2% |
% of Total Revenue | 84.68% | 87.56% | 86.66% | 62.63% | 61.14% | 52.40% | 27.77% | 17.00% | 14.11% | |
Total | 1,703 | 1,667 | 1,718 | 1,630 | 1,472 | 1,334 | 1,340 | 1,740 | 1,354 | |
Growth % | 79.7% | -2.1% | 3.1% | -5.1% | -9.7% | -9.4% | 0.4% | 29.9% | -22.2% | 7.2% |
Source: Company Data, Khaveen Investments
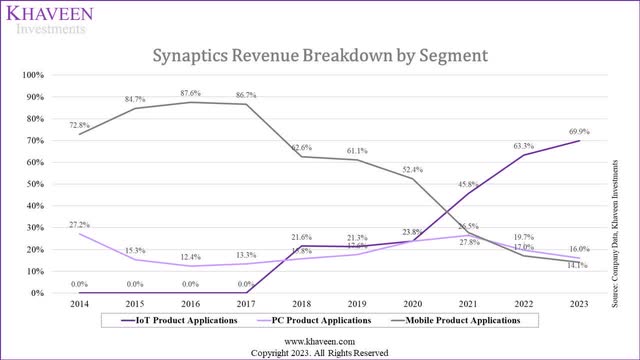
Based on its annual reports, the company has three product segments which are IoT, PC, and Mobile. From the table, the revenue from IoT product applications has been increasing over the years, while the revenue from PC and Mobile product applications has been decreasing. The average growth rate for IoT product applications is the highest among the 3 segments at 29.8%, while the average growth rate for PC and Mobile product applications is much lower in contrast at -0.2% and -6.2%, respectively. Supported by the strong growth of its IoT segment, the total average growth rate for the company is positive at 7.2%. In 2023, IoT product applications make up 69.9% of the total revenue, while PC and Mobile product applications make up 16.03% and 14.11%, respectively.
Company Data, Khaveen Investments
Therefore, this highlights the company’s shift from Mobile product applications to the IoT segment. According to the Motley Fool in 2018, Synaptics lost a contract to supply chips to Samsung which was its largest customer (17% of revenue) and is the top smartphone maker by market share, contributing to its Mobile segment decline of 31% in that period. Compared to now, based on its annual report, the company’s largest customer represented 13% of revenue and its top 4 customers accounted for 34% of total revenue combined, thus we believe highlights a lower customer concentration risk compared to in 2018.
Furthermore, in relation to its shifting focus to the IoT segment, in 2020, Synaptics acquired certain Broadcom (AVGO) IoT business assets in a deal worth $250 mln including …
certain rights to Broadcom’s existing Wi-Fi, Bluetooth and GPS/GMSS products and business in the IoT market as well as future roadmap devices.
Recently, in 2023, Synaptics made a new deal with Broadcom to add…
Broadcom’s best-in-class Wi-Fi 7, Bluetooth 6.0, and Bluetooth Enterprise True Wireless Stereo (TWS) IP” to expand Synaptics’ IoT portfolio.
Besides that, Synaptics had also acquired DisplayLink in 2020 in a $305 deal which allows Synaptics to have access to…
Display Link’s software technology that enables universal docking and casting of high bandwidth video from any device to any display using transport medium.
Also, the company acquired Conexant Systems, a company with voice and audio processing solutions for smart homes in 2017 and Marvell’s (MRVL) Multimedia Solutions Business for video and audio applications for smart homes in 2017. Prior to this, the company’s acquisitions were focused on its Mobile segments such as Renesas SP Drivers (OTCPK:RNECF) for the Mobile segment with Display Driver ICs (DDICs in 2014 and Validity Sensors for biometric identification in 2013. Therefore, we believe its acquisitions reflect the company’s shift in focus toward its IoT segment. Below, we further examined the impact of the company’s profitability with the shift to the IoT segment from the Mobile segment.
Profitability Supported by IoT Segment
Company Data, Khaveen Investments
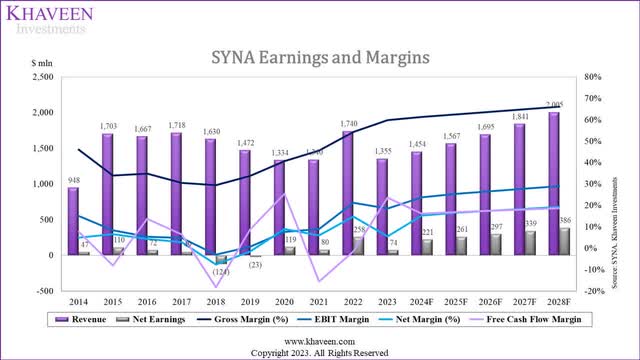
Based on its annual reports, the company’s gross margins improved from 2018 to 2022 mainly due to a favorable product mix, product cost reductions, and lower inventory fair value adjustments. These factors were partially offset by higher acquired intangibles amortization related to various acquisitions. Furthermore, its net margins have also improved over the past 6 years.
However, prior to 2018, the company’s profitability exhibited a deteriorating trend. The company’s annual reports highlighted its gross margins were impacted to due inventory fair value adjustments of its past acquisitions such as the Conexant Acquisition and the Marvell Business Acquisition as well as lower margins on TDDI products for its smartphone segment.
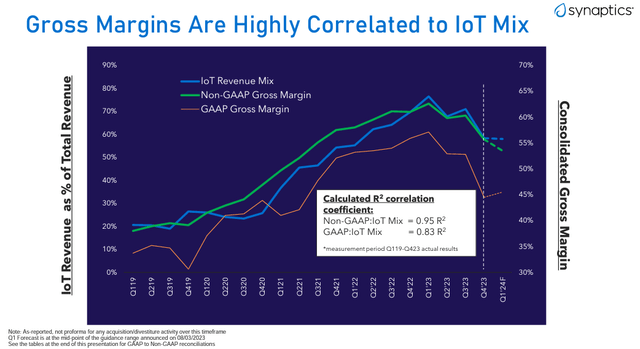
Thus, based on the chart, its margins indicate a turnaround following the deterioration of its margins before 2018 and a recovery following that through 2023. We examined the company’s presentation slide below which highlights the correlation between its IoT segment share of revenues and total company margins.
Synaptics
Based on the chart above, the company’s gross margins increased as the company’s IoT segment share of revenue increased, thus indicating that its margins increase was attributed to the rise of its IoT segment. Furthermore, based on the company’s annual report, the company attributed the increase in its margins because of…
favorable mix due primarily to IoT business products which have higher gross margins.
Thus, we do not expect the company’s margins to improve significantly since they have increased significantly from 2018 to 2023. The company’s IoT segment had increased from 21.6% of revenue to 70% by FY2023, thus we believe the potential increase is limited going forward and unlikely to continue driving margins higher.
IoT Segment Supports Growth Outlook
Market | Market Size 2022 ($ bln) | Market Forecast CAGR |
Video Processing Silicon | 6.83 | 18.40% |
Ultra Low Power Microcontroller | 4.9 | 10.30% |
Audio DSPs | 3.4 | 13.80% |
Wireless Connectivity | 8 | 8.36% |
Display Driver IC | 2.41 | 4.34% |
Weighted Average | 25.54 | 11.76% |
Source: Research and Markets, MarketsandMarkets, MarketsandMarkets, Mordor Intelligence, Verified Market Research, Khaveen Investments
Based on the company’s annual report of its product description, we compiled the market size and forecast CAGR to project the company’s IoT segment growth. As seen in the table above, we derived a total market size of $25.5 bln with a weighted average CAGR of 11.8% based on the video processing silicon, ultra-low power microcontroller, audio DSPs, wireless connectivity and display driver IC markets.
Synaptics
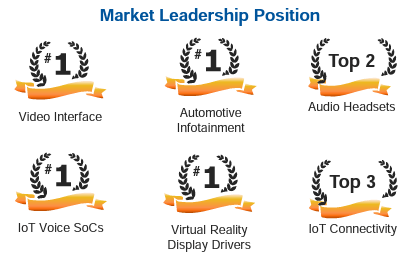
Based on the company, the company claimed to be a leader in video interface, automotive infotainment, IoT voice SoCs and virtual reality display drivers. However, we are skeptical of its claims as based on the total market size of the company’s products from the table above, the company’s total share based on its IoT segment revenue of $947 mln would be only 3.3%. The company highlighted that it competes against larger companies such as Infineon (OTCQX:IFNNY), Qualcomm (QCOM), MediaTek (market leader of smart speaker and smart display application processors with Synaptics at second), and NXP (NXP) based on its annual report.
Revenue Breakdown ($ mln) | 2021 | 2022 | 2023 | 2024F | 2025F | 2026F | 2027F | 2028F |
IoT product applications | 613 | 1,101 | 946 | 1,057 | 1,182 | 1,321 | 1,476 | 1,650 |
Growth % | 93.0% | 79.6% | -14.1% | 11.76% | 11.76% | 11.76% | 11.76% | 11.76% |
% of Total Revenue | 45.8% | 63.3% | 69.9% | 72.8% | 75.5% | 78.0% | 80.2% | 82.3% |
PC product applications | 354.7 | 343.0 | 217.0 | 216.6 | 216.3 | 215.9 | 215.5 | 215.2 |
Growth % | 11.8% | -3.3% | -36.7% | -0.2% | -0.2% | -0.2% | -0.2% | -0.2% |
% of Total Revenue | 26.48% | 19.72% | 16.03% | 14.91% | 13.81% | 12.74% | 11.72% | 10.74% |
Mobile product applications | 372 | 296 | 191 | 179.2 | 168.1 | 157.6 | 147.8 | 138.6 |
Growth % | -46.8% | -20.5% | -35.4% | -6.2% | -6.2% | -6.2% | -6.2% | -6.2% |
% of Total Revenue | 27.77% | 17.00% | 14.11% | 12.33% | 10.73% | 9.30% | 8.04% | 6.92% |
Total | 1,340 | 1,740 | 1,354 | 1,453 | 1,566 | 1,694 | 1,839 | 2,003 |
Growth % | 0.4% | 29.9% | -22.2% | 7.3% | 7.8% | 8.2% | 8.6% | 8.9% |
Source: Company Data, Khaveen Investments
We projected the company’s total revenue growth by segments in the table above. For IoT product applications, we based our projections on our derived weighted average CAGR of 11.8% for the IoT segment as explained above. Moreover, for its PC and Mobile segments, we used the company’s 9-year average growth rate of -0.2% and -6.2% respectively as a conservative assumption given its poor past performance for these two segments. Overall, we projected the company’s revenue to grow at an average of 8.1% driven by its IoT product applications at a CAGR of 11.8% and we calculated its IoT segment share of total revenues to reach 82.3% by 2028.
Risk: Limited Margins Growth
As discussed, the company’s gross margins have risen in correlation with the growth of its IoT segment’s revenue share attributed to the higher gross margins of IoT products, as mentioned in the annual report. However, considering that the IoT segment now constitutes 70% of total revenue, a substantial 48% rise from 2018, we believe it is unlikely that further significant margin improvement will continue. Additionally, we believe there could be a risk if the company fails to achieve its growth outlook for the IoT segment despite shifting its focus to the segment. Excluding the company’s acquisition of Broadcom and DisplayLink in FY2021 and FY2022, the company’s IoT segment growth was negative at an average of -7.9%.
Verdict
The company’s gross margins increased alongside the expanding revenue share of its IoT segment, primarily due to the higher gross margins of IoT business products, as stated in the annual report. However, future significant margin improvement is unlikely, given the substantial rise in margins from 2018 to 2023 and the IoT segment’s dominance, accounting for 70% of revenue, a 48% increase since 2018.
Our growth projection for the company considers different segments: IoT product applications are estimated to grow at an average market CAGR of 11.8%, while we assumed its PC and Mobile segments growth of -0.2% and -6.2% respectively based on its past 9-year average. Overall, we anticipate the company’s revenue to increase at an average rate of 8.1%, driven by strong growth in IoT product applications. However, this is lower compared to its past 10-year growth of 10.8%. Furthermore, as its margins growth had been dependent on the increase of its IoT segment share of total company revenue, we believe the company’s ability to continue to improve its margins will be more limited as we estimate its IoT segment revenue share to reach 82% of revenues by 2028, an increase of 12% of total revenues compared to the past 48% increase from 2018 through 2023.
Notwithstanding, the company’s P/E ratio of 10.95x is 43% lower than the sector median of 19.2x thus we believe this indicates an attractive valuation. We rate the company as a Buy with a target price of $98.89 based on analyst consensus, with an upside of 11.5%.


")


