

primeimages
A guest post by D Coyne
The EIA’s Short Term Energy Outlook (STEO) was published in early June. The chart below estimates World C+C by using the STEO forecast combined with past data from the EIA on World Output.
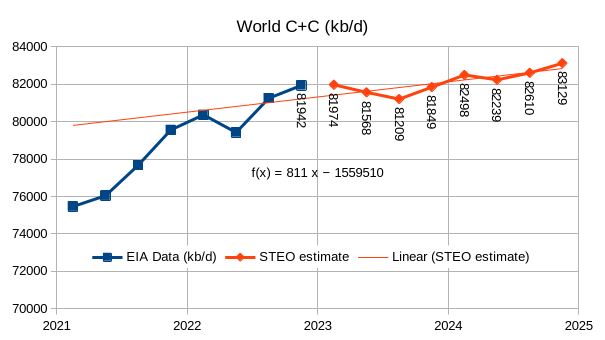
Figure 1
Output rises to 81849 kb/d in the final quarter of 2023 and to 83129 kb/d in 2024Q4. Annual average World C+C output was 80752 kb/d in 2022 and rises to 81650 kb/d in 2023 and to 82619 kb/d in 2024.
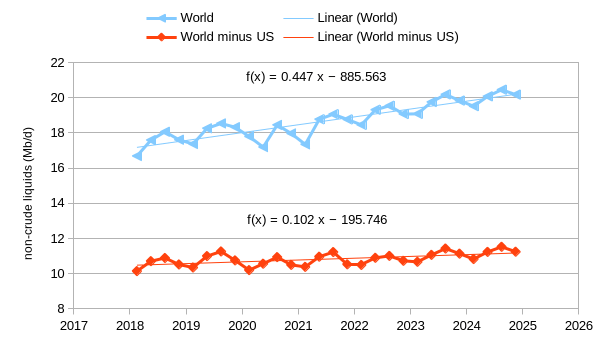
Figure 2
The chart above considers World non-crude liquids output (note that “crude” in this case is C+C) and compares with non-crude liquids output for the World minus US (excludes non-crude liquids produced in the US). About 77% of the increase in World non-crude liquids output over the 2018 to 2024 period will come from the US if the STEO forecast for 2023 and 2024 is accurate (it usually is not.)
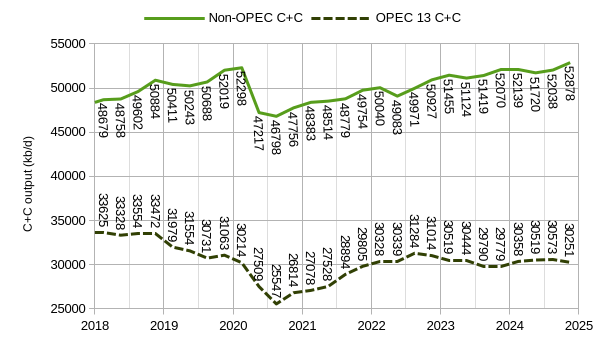
Figure 3
Chart above shows OPEC 13 and Non-OPEC output with STEO estimate after 2022Q4 (last 8 points on each series).
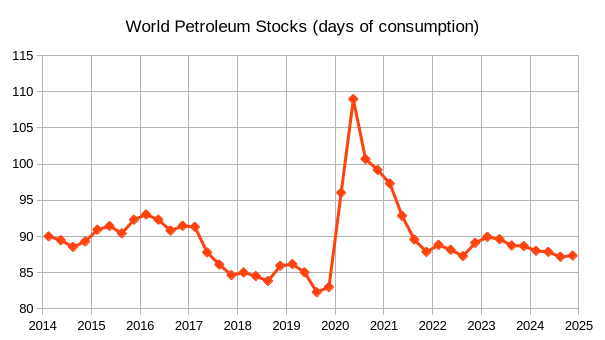
The chart above uses the EIA World liquids supply and demand balance from 2014Q1 to 2024Q4 from the STEO and assumes that in 2014Q1 the World Petroleum Stocks were 90 days of 2014Q1 consumption. Generally, nations aim for about 90 days of petroleum stocks and I have assumed this aim was met in the first quarter of 2014. This choice was arbitrary. Oil prices will usually rise as stock levels fall below 90 days of consumption, though poor visibility of World stock levels makes this a rough estimate (in reality, it tends to be in the range of 88 to 92 days of consumption). Chart below shows average quarterly Brent Spot prices over the 2014 to 2023 period.
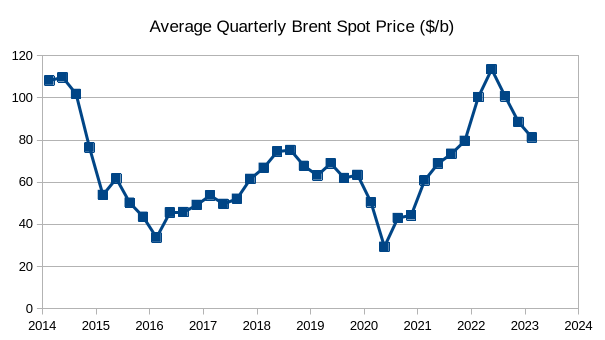
Figure 5
I expect that oil prices may rise as stock levels fall below 90 days of consumption by 2023Q3 if the EIA STEO supply and demand estimates are accurate.
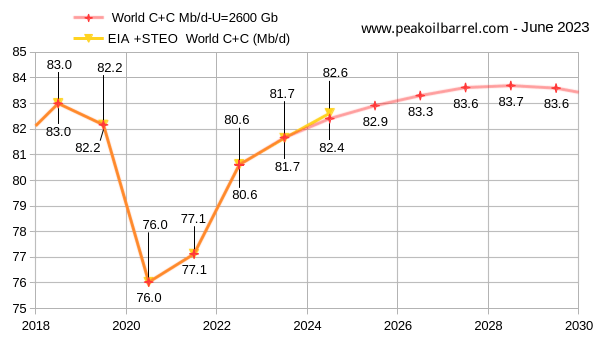
The chart above uses Paul Pukite’s Oil Shock Model to estimate future output with the assumption that a transition to electric transport reduces oil demand to less than supply by 2032 (+/- 2 years). The data above the line is EIA data up to 2022 and 2023 and 2024 are the STEO estimates, the data below the line is the model output. The 2018 peak is exceeded in 2025 for my best guess model (100% probability this will be wrong) and the peak is in 2028 at 83.7 Mb/d.
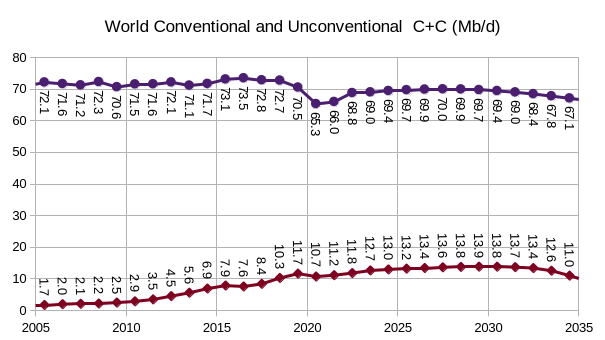
The figure above shows conventional and unconventional C+C output for the Oil Shock model in Figure 6. Unconventional C+C is defined as US Tight Oil (LTO) and extra heavy oil (API Gravity of 10 degrees or less) produced from Canadian Oil Sands or Venezuela’s Orinoco belt, conventional C+C is all C+C that cannot be classified as unconventional as defined above. From 2018 to 2028, unconventional output increases by 3.5 Mb/d while conventional output decreases by 2.8 Mb/d, there is a net increase in World C+C output of 0.7 Mb/d in 2028 above the previous 2018 peak. The unconventional C+C URR for this scenario is 170 Gb.
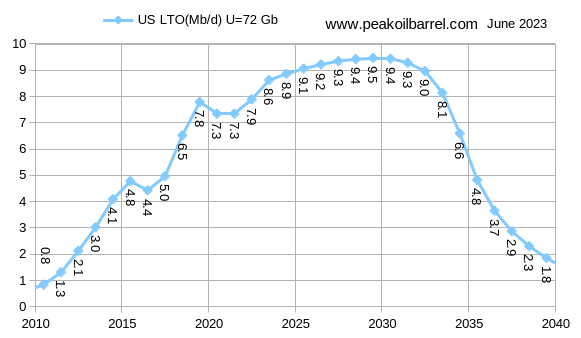
The tight oil model used in my most recent shock model has a lower URR than the model presented last month (72 Gb vs 81 Gb), there is a shorter plateau (2028-2030) and a thinner tail with completion rate assumed to fall after 2029 due to a combination of fewer profitable locations to drill new wells and lower oil prices as more land transport moves to electricity. More details on this scenario below.
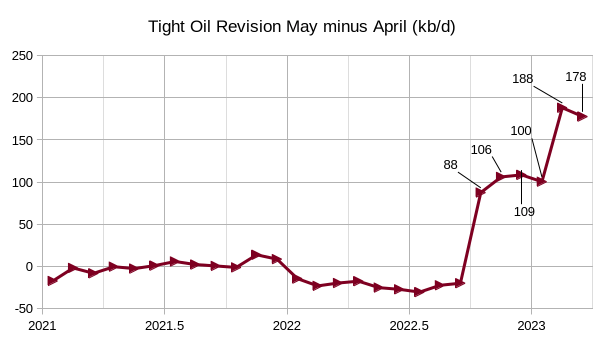
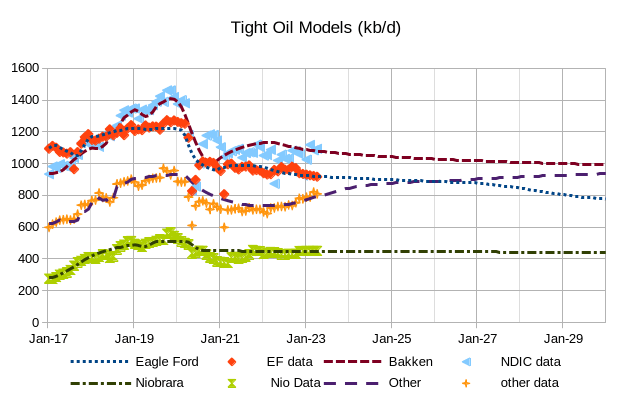
There was a large revision in last month’s EIA official tight oil estimate, especially for the months of October 2022 to March 2023 (the revisions for those months are indicated in figure 9) with the revisions for February and March at 188 and 178 kb/d, higher than the May report. There were also revisions lower by roughly 25 kb/d for Feb 2022 to Sept 2022.
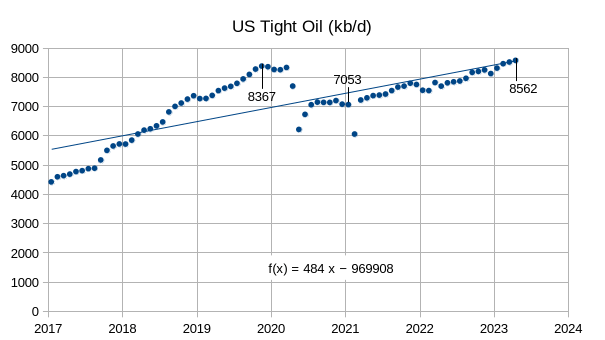
The chart above gives an overview of US tight oil output from Jan 2017 to April 2023 with the long-term OLS trend at an annual rate of increase of 484 kb/d using all data from Jan 2017 to April 2023 (no data is dropped from the regression). For the past 24 months, US tight oil has increased at an annual rate of 580 kb/d or a monthly rate of about 48 kb/d each month based on a linear regression using ordinary least squares (OLS). An endpoint estimate using a line through April 2021 and April 2022 gives an annual rate of increase of 640 kb/d over that period (slightly higher than the OLS estimate) with a monthly rate of increase of about 53 kb/d.
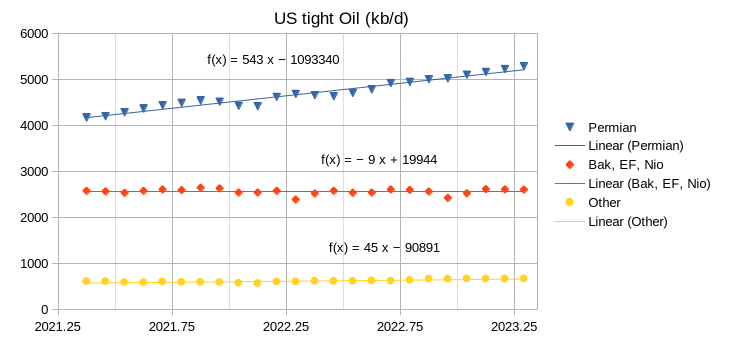
Most of the increase in US tight oil output over the past 24 months has come from the Permian basin with a small contribution from ”other” tight oil plays such as the Anadarko, Powder River, and some contribution from shale gas plays which yield some lease condensate. Tight oil output from the Bakken, Eagle Ford, and Niobrara plays as a group was trending down at an annual rate of 9 kb/d over the past 29 months. Output from all non-Permian tight oil plays was slightly increasing at an annual rate of 36 kb/d or a monthly rate of 3 kb/d over the past 24 months. Last month’s estimate for the past 24 months (April 2021 to March 2023) for non-Permian tight oil output was a decrease of 45 kb/d. The revisions in the data and a shift in the period covered by one month resulted in a net increase of 81 kb/d for non-Permian output compared to last month’s estimate. The change in the Permian annual rate of increase in output was relatively minor by comparison at an increase of 8 kb/d from 535 kb/d last month to 543 kb/d for the most recent estimate.
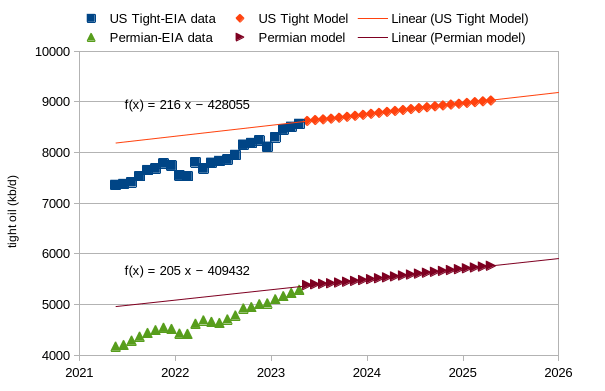
The chart above shows projected output for a scenario where the completion rate for US tight oil wells remains constant at 15 wells less than the April 2023 level from Sept 2023 until April 2025. US tight oil increases at an annual rate of 216 kb/d from May 2023 to April 2025 and Permian output increases at an annual rate of 205 kb/d over the same period. These rates are about 67% of the rates of increase reported last month (about 315 kb/d) as the scenarios have been revised.
Note that the scenarios above assume no increase in the new well completion rate after Sept 2023 which is 15 wells below the April 2023 rate of completion, it remains constant from September 2023 to February 2029. There was a slight revision to the “Other” tight oil model where other plays are those that are not Permian, Bakken, Eagle Ford, or Niobrara plays. Bakken URR is 9.5 Gb, Eagle Ford URR is 8.5 Gb, Niobrara URR is 3.5 Gb, and Other tight oil URR is 8.5 Gb, with a total URR for non-Permian tight oil plays at 31 Gb.
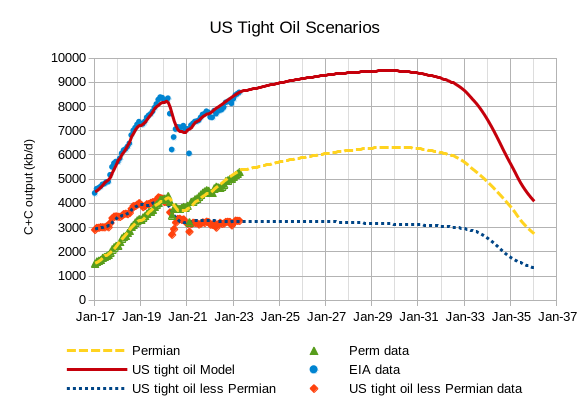
The chart above simply is the sum of the scenarios presented in Figure 13 (US tight oil less Permian) plus the Permian scenario shown in Figure 14. I extend the chart out to 2036 to show the expected output decline, which falls by half in 3.33 years from 9000 kb/d in June 2032 to 4480 kb/d in Sept 2035. The URR of the tight oil scenario is about 72 Gb (9 Gb smaller than the scenario presented last month). The average annual rate of increase from May 2023 to April 2029 is about 1.6% per year for this scenario. The Permian scenario has a URR of 40 Gb with a peak of 6.32 Mb/d in Jan 2030, and the US tight oil scenario peaks in November 2029 at 9.47 Mb/d.
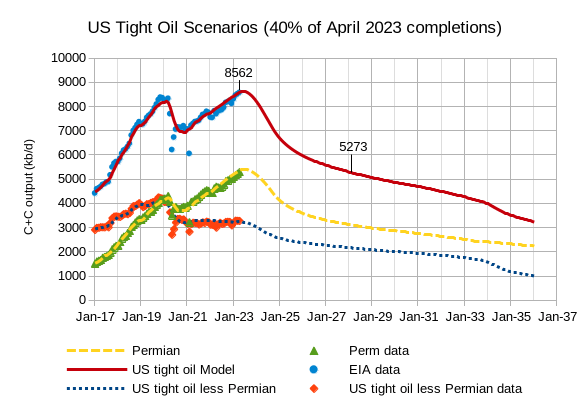
The scenario above reduces April 2023 tight oil completions by half in each non-Permian basin over a 12-month period from May 2023 to April 2023 and Permian completions are reduced to one-third of the April 2023 level by April 2024. Overall, the completion rate is reduced from 955 wells per month completed in April 2023 to 380 wells per month in April 2024. US and Canada have refinery capacity to handle about 4600 kb/d of tight oil. In order to avoid US crude exports outside of North America, we need to aim for 4600 kb/d of tight oil output. The scenario in figure 15 would reduce US tight oil output to about 4600 kb/d by July 2031, in Feb 2028, crude exports outside North America are reduced to about 700 kb/d. The URR of the scenario in figure 15 above is 58.5 Gb and note that the completion rate could be increased after July 2031 to keep tight oil output flat if desired. Note that in 2019, about 5290 kb/d of tight oil was refined in the US (or was produced and not exported outside North America), it is unclear why there is such a large difference between 2019 and 2022. Perhaps LTO is being produced in the Canadian Bakken and has reduced Canadian demand for LTO (this would explain about 200 kb/d of lower exports to Canada in 2022 compared to 2019); also, some refinery capacity for tight oil may have been shut down in the US during the pandemic. It seems likely that the estimate based on 2022 data is more accurate.
Original Post
Editor’s Note: The summary bullets for this article were chosen by Seeking Alpha editors.
")


