

cemagraphics
Another inside week traded in the S&P 500 (SPY) as the sideways range continued and contracted. This is frustrating action but can’t continue indefinitely and we should see range expansion this week. The question is, which way will it break?
Last week’s article highlighted the bias for a break lower past 4430. Obviously, this hasn’t happened yet, but Friday’s move appeared to support the call with a strong drop and weak close. A large move could be setting up so this week’s preparation is focused on how this could develop and where it could target.
A variety of tried and tested technical analysis techniques will be applied to the S&P 500 in multiple timeframes. The aim is to provide an actionable guide with directional bias, important levels, and expectations for price action. The evidence will then be compiled and used to make a call for the week(s) ahead.
S&P 500 Monthly
With over half the month gone, September is still contained in a small range within the range of the August bar (which itself was nearly within the range of July). The volume profile on the right of the chart now shows a bell curve between 4325 and 4607 indicating balance.
The most important takeaway from the monthly chart at this juncture is its bullish bias due to the lack of a reversal pattern at the 4607 high. New highs should be made at some point.
SPX Monthly (Tradingview)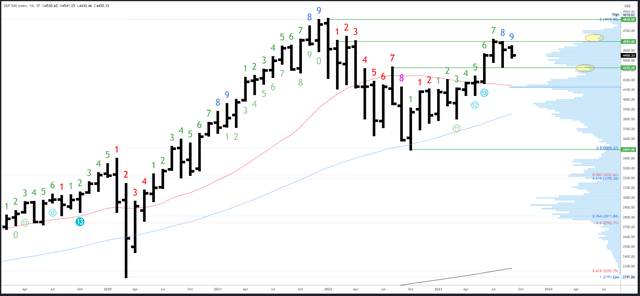
Monthly resistance is 4593-4607. 4637 is the next level above, then the all-time high of 4818.
4325-35 is significant support followed by 4195-4200.
The September bar is number 9 (of a possible 9) in a Demark upside exhaustion count so will complete the signal. The dip in August was probably an early reaction, but I’d expect a more prolonged effect and longer pause as rallies struggle to hold gains.
S&P 500 Weekly
A second weekly ‘inside bar’ has been created by the choppy, sideways conditions. Its small range of 4447-4511 looks almost certain to break next week so this should lead to expansion and a push through the extremes of the ‘mother’ bar at 4415-4541.
This week’s weak close at 4450 gives a bearish bias to at least undercut the 4447 low. It may not sound like much, but this can be useful if Monday’s session opens higher and rallies; chasing the rally would have low odds. Furthermore, a move below 4447 is the minimum expectation and barring a reversal, lower supports should soon be in play.
SPX Weekly (Tradingview)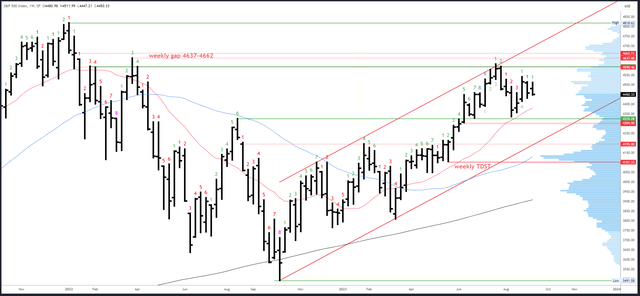
4541 is the first resistance, then 4594-4607. A break of 4607 should lead to the weekly gap at 4637-4662.
A small weekly gap at 4405-4415 is the first potential support area, with 4356 below. 4325-35 remains the key level, with a small gap at 4298-4304 should this area be flushed.
An upside (Demark) exhaustion count completed in July and has already had an effect with the August drop. New counts are getting interrupted by the choppy conditions and a clean trend is needed to progress towards the next exhaustion signal.
S&P 500 Daily
There is a developing head and shoulders pattern on the daily chart with the neckline in the 4335 area. Expect this to get a lot more attention should price get closer to the neckline. What better way to shake up the current stasis and generate volume? If it does trigger, it may be a potential trap to get bears short in the hole. I’d actually like to see this happen as I would then be much more confident the bottom is in.
Last week’s call for a move down through 4430 is still valid and Friday’s strong decline supports this call. The issue next week is where exactly the decline will target. A measured move now projects 4401, and 4397-4401 is an area of support. However, a move through 4415 would break a 3-week contracting range and enough energy has built up for a larger move. Lower supports could easily come into play.
SPX Daily (Tradingview)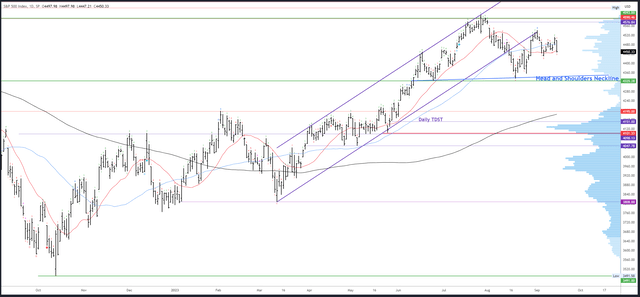
4511 is the first resistance, then 4541.
Potential supports are 4415 and 4356, then 4325-35.
Conditions have been too choppy for any Demark exhaustion signals to develop.
Events Next Week
The FOMC meeting on Wednesday is the main event of the week. A pause is almost guaranteed, as is a hawkish stance given this week’s strong inflation and retail sales data. There could be a nod to further hikes in November or December and the Fed won’t want to make the same mistake as the ECB who this week signalled they were likely finished hiking.
Yields and the dollar look strong and should make further gains into tops in early Q4.
PMI data is due out on Friday.
Probable Moves Next Week(s)
Bigger picture, the S&P 500 is working off monthly upside exhaustion. There is still a bias for eventual new highs but the general expectation is for range trading and any moves outside 4325-4607 are likely to be unsustained.
Near-term, there is a bearish bias for a swing lower through 4430. This follows on from last week’s call and now has further evidence from the strong decline on Friday and the weak close. Also, the range contraction over the last 3 weeks looks set to break. This could trigger a burst of volatility (FOMC meeting induced?) and if the decline breaks 4415-30 in the same manner as Friday’s move, look out below.
4335-56 is potential support, but a strong move into this area would be bearish and I doubt it would hold again. Indeed, the ideal scenario would shake out bulls and trap bears with a capitulation followed by a reversal. I have said this before and it didn’t happen, but it is especially true now there is the neckline of a large head and shoulders pattern in the same place. The first test of 4335 should lead to a bounce, but a brief one to set up a final drop (the bear trap) to 4298-4301, which is gap fill and the 38.2% Fib retrace of the March-July rally. A subsequent reversal back over 4325-35 would be a solid bullish signal and almost certainly cement a strong bottom.
While I have a short-term bearish bias, I am prepared to be proven wrong. The best odds come from strong trends when the monthly, weekly and daily charts are all saying the same thing. This is clearly not the case at the moment, and the S&P 500 is trading a choppy range with a lot of possibilities. I can’t list every possibility here ahead of time, but I will try and leave a comment under this article should the daily chart shift back bullish.


