cemagraphics
The 4325-37 support area in the S&P500 (SPY) has been highlighted for several weeks now and was finally tested this week. Monday’s session closed right on 4328 and this marked the low of the correction. Surprisingly, there was no real capitulation to flush out the last of the bulls, and the 4325 major support was never breached. However, that’s not to say the buying opportunity was ‘easy’ – either you bought a weak close at the lows, or chased a gap higher on Tuesday. Indeed, it was easier to buy 4362 (a level also highlighted in last week’s article) later in the week.
New 2023 highs were made on Friday, which gives a bullish bias early next week. However, Independence Day could interrupt the flow. A new month and new quarter will get underway, and trading is generally quieter after the July 4th holiday. So what to expect over summer? Is there a chance of another reversal or even a top?
To answer these questions, a variety of technical analysis techniques will be applied to the S&P 500 in multiple timeframes. The aim is to provide an actionable guide with directional bias, important levels and expectations for price action. I will then use the evidence to make a call for the week ahead.
S&P 500 Monthly
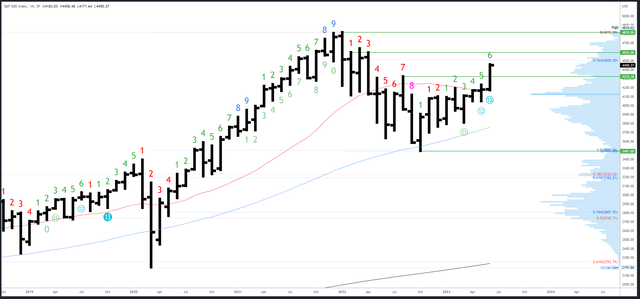
As expected, the June bar closed out Q2 on Friday with a ‘window dressing’ rally. A strong close near the highs bodes well for Q3, at least in the beginning, and resistance at 4593 should be reached at some point.
SPX Monthly (TradingView)
There is minor resistance at the 76.4% Fib at 4505, followed by monthly references starting at 4593.
4325 is potential support, then 4230 at May’s high, with 4195-200 a major level just below.
An upside Demark exhaustion count will be on bar 7 (of 9) in July. We can expect a reaction on either bar 8 or 9 should new highs be made (compared to the other bars in the count) so it could be over two months until we see higher timeframe exhaustion.
S&P 500 Weekly
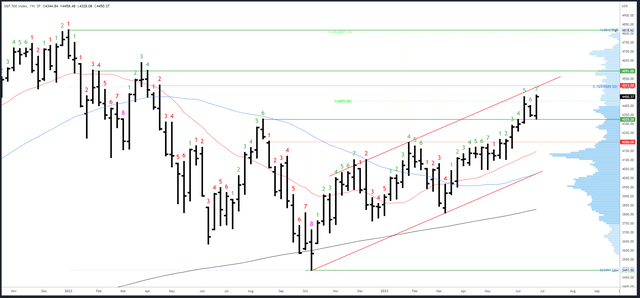
This week’s action created an ‘outside bar,’ completely engulfing the range of the previous week. Coupled with the new 2023 high and strong close, this is a bullish pattern. Continuation to new highs is expected early next week.
One potential hurdle comes from the weekly upside exhaustion (Demark) count which will be on bar 8 (of 9) next week. As mentioned in the previous section, we often see a reaction on bar 8 or 9, either a dip / pause (most likely), or full reversal. It isn’t necessarily a reason to sell, but it does mean resistance levels have a better chance of holding.
SPX Weekly (TradingView)
4505-4513 is the next resistance at the 76.4% Fib and weekly pivot high. This will also line up with the channel highs should it be reached.
4325-28 is now initial support, and there is a weekly gap fill at 4298.
As mentioned earlier, an upside (Demark) exhaustion count will be on bar 8 (of 9) next week.
S&P 500 Daily
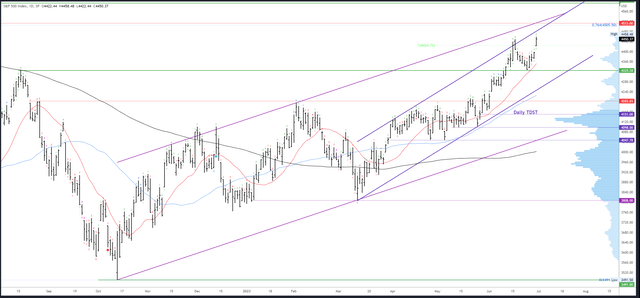
Friday’s gap higher acts as a near-term inflection. Monday’s half session and Wednesday’s re-opening should really hold above 4422 for the momentum to continue.
A daily channel converges with the weekly one in the low 4500s and these are in confluence with the weekly resistance area of 4505-13. The rally should really continue to test this area with only minor dips of around 20-30 points.
Only a sharp reversal and weak close below 4422 would flip the view bearish for 4362, even 4325 again.
SPX Daily (TradingView)
Potential support is at the 4422 gap, 4396 gap fill and 4362.
An upside exhaustion (Demark) count will be on bar 3 (of 9) on Monday. There is also a developing 9-13 sequential count which could complete towards the end of the week. These counts have mixed results in strong trends, but coupled with the weekly exhaustion, it is something to take into account should there be a bearish reaction at resistance.
Events Next Week
Markets close at 1pm on Monday and are shut all day Tuesday for the Independence Day holiday. ISM Manufacturing PMI data is released on Monday while Services PMI is on Thursday. FOMC Minutes are out on Wednesday, and the highlight of the week is NFP on Friday.
Recent data has been strong and yields are rising, as are the odds of a second further hike from the Fed, which now stand at 40%. The S&P500 has been rallying lately on good data with seemingly little concern for what the Fed does. This could change at some point, perhaps when the 10Y yield crosses above 4% or hot data makes a second hike almost certain.
Probable Moves Next Week
The rally looks set to continue, but this Friday’s ramp should have marked the strongest phase (the continuation gap) and momentum could slow as it makes its way towards 4500.
4422 and the gap window must hold for the trend to remain trustworthy. A weak close below that point would suggest the S&P500 is still in correction mode and can fall back near this week’s lows.
If and when 4505-12 resistance is reached, I will look for a reversal and any signs of weakness. This could lead to a 50-100 point drop, but I do not expect a top to be formed, yet.


