Andrii Atanov
Company Profile And Recent Performance
Silicon Motion Technology Corporation (NASDAQ:SIMO), a small-cap fabless semiconductor stock, could serve as a fitting proxy to play the global SSD-related NAND flash controller market, where it is the leader. Besides the supply of SSD controls in PCs, SIMO is also noted for its expertise in eMMC (Embedded Multi-media card) and UFS (Universal Flash Storage) controllers, which are typically used in smartphones and IoT devices. Overall, note that over the last decade, no other competitor in this space has shipped more controllers than SIMO (6 billion).
In addition to its broad controller competence (the controllers are marketed under the SMI brand), the company also supplies specialized single-chip form factor SSDs that are typically used in industrial, commercial, and automotive applications.
In the first 9 months of the year, the SIMO stock has proven to be a disappointment of sorts, crumbling by -22% and significantly underperforming the tech-heavy Nasdaq, which has seen its market cap grow by a third during the same period.
YCharts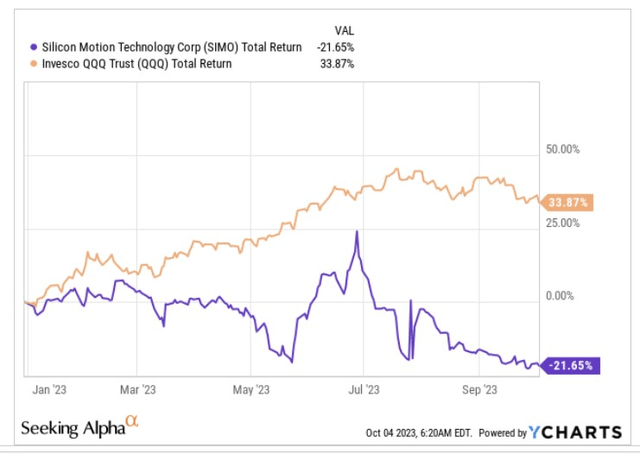
However, we now think that SIMO may well be on the cusp of witnessing a reversal of fortunes, as things are now looking up.
A Few Reasons To Turn More Constructive
Firstly, there are signs that weakness in the NAND flash memory markets is dissipating. SIMO itself confirmed that inventory levels were fast normalizing at the customer end, as well as the broader PC and handset markets, and they themselves expect a 15-20% sequential improvement on their topline in Q3 (this comes on the back of a 13% QoQ improvement seen in Q2). Other industry reports have also suggested that the lingering oversupply ratio in the NAND flash market could well reverse by Q4. Production cuts are now well on the cards, and the financial health of some of the major players in the NAND flash market too could pick up, with potential pricing uplifts on the anvil. All in all, by next year, while NAND flash bit supplies may likely only grow at less than mid-single-digits, demand could come in at a much healthier pace of 16%.
TrendForce
Then SIMO’s gross margins have been on a downward slump for multiple quarters now (currently at the 40% levels), but management now believes that it will bottom out at these levels, and could potentially even improve in Q3. The major driver here is that the sales mix in recent quarters has been shifting towards SIMO’s SSD solutions (over controller sales) which are more plain-vanilla in nature with limited differentiating effects, thus dampening the ability of SIMO to add ample mark-ups. In a couple of quarters’ time, we think the sales mix could revert to more normalized levels, which should lift the overall gross margins trajectory.
YCharts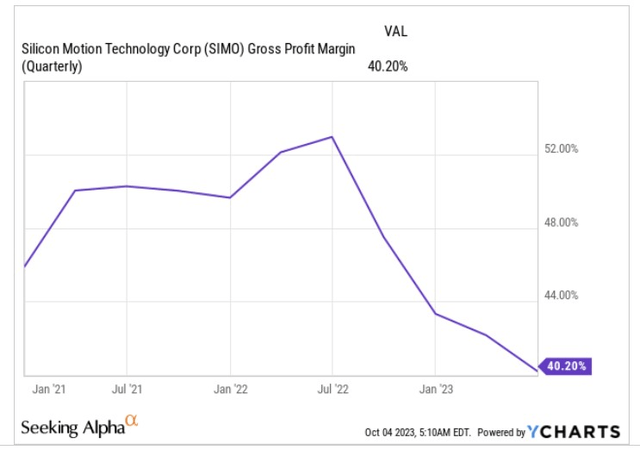
Improving order visibility and better financial health of SIMO’s customers is also reflected in the manner in which SIMO was able to curtail its receivable days in Q2, which in turn provides further support for better operating cash generation. There’s still ample scope for SIMO to improve on this front, as the current receivable days are still around 33% higher than what the company has normally witnessed over the last 5 years.
YCharts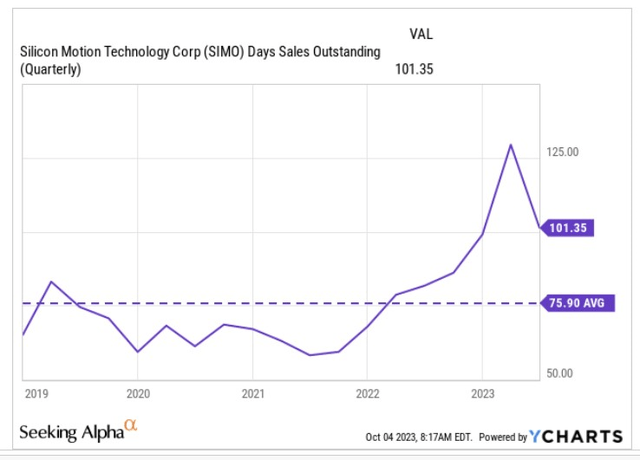
Then, also consider how cheaply priced the SIMO stock currently looks. According to YCharts, it can now be picked up at just 13.9x, which translates into a 25% discount over the stock’s long-term average.
YCharts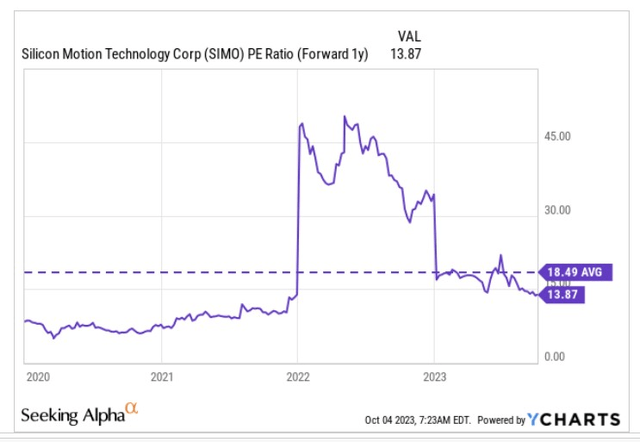
Those valuations look even more appealing when you consider the quantum of earnings growth you could be getting through FY25. For a business that’s priced at 14x, it seems like an excellent deal when you’re getting a 2-year earnings CAGR of 60% (FY23-FY25).
YCharts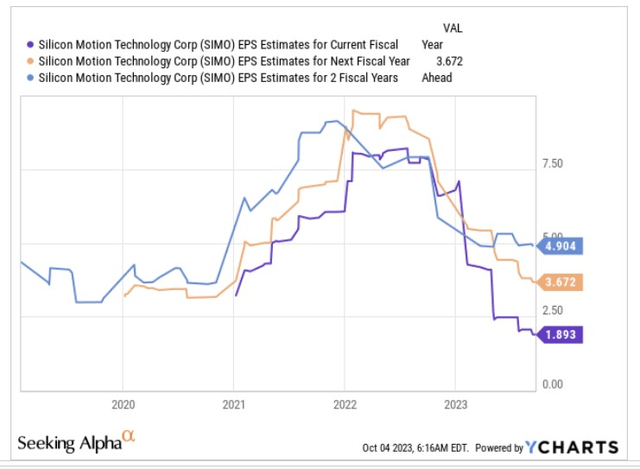
Then, even with the failed merger with MaxLinear, we don’t believe that investors need to overly fret; in fact, there are some silver linings to consider from this development. Firstly, it is highly likely that SIMO will receive “substantial” damages beyond the original $160m termination fee, as it appears that MaxLinear played the “material breach of the merger agreement” card only at the eleventh hour, and even as late as July 19th (MaxLinear’s notice of termination came through on July 26th) the company was pushing for federal antitrust approval.
Crucially, it’s also worth highlighting that the failure of this merger will also reopen the door for SIMO to get back to being a dividend-paying entity again. If one were to assume a similar cadence to the old quarterly dividend distributed ($0.5 per share), you could be looking at a stock with a healthy yield of almost 4%, something which could serve as a useful cushion during drawdowns
Closing Thoughts – Risk-Reward Looks Attractive
We’re also particularly enthused with the risk-reward on offer, both on SIMO’s standalone weekly chart, as well as its relative strength chart (versus the broad semi universe).
On SIMO’s weekly chart (image below), we can see that for over 2.5 years, the stock has chopped around within a certain range. The upper boundary appears to be at around the $95-$100 levels (area highlighted in blue), and the lower boundary appears to be around the $50 levels (area highlighted in yellow). Until recent weeks, we’ve seen a couple of instances where the stock drops to these levels and pivots back up, thus reflecting the presence of bargain hunters at these levels (we’ve already noted how SIMO is priced quite cheaply right now). Once again, we’re at those levels, whilst we’re also a long way off the upper boundary.
Investing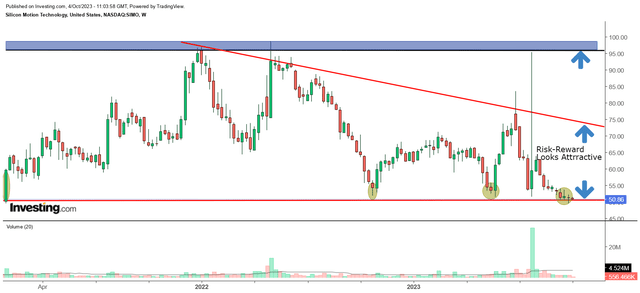
Now, there are a few cynics who believe that SSDs may transition to adopting other forms of non-volatile memory tech (beyond NAND flash) over time, and if this trend snowballs, it would be difficult to imagine SIMO hitting those 95-100 levels again. However, even if you want to be more conservative, consider the downward-sloping red boundary which the price has struggled to close past for a while now; even from those levels (currently at around $73) the stock is quite some way off.
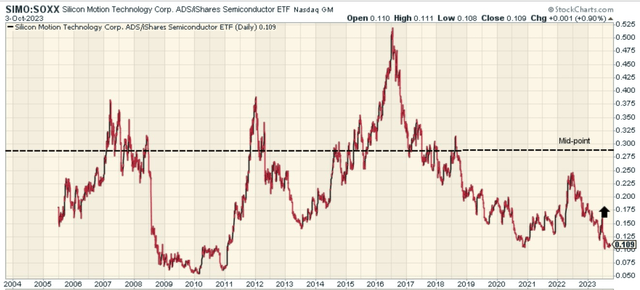
Then, also note the chart below, which helps to ascertain if SIMO could work as a prospective rotational candidate within the semiconductor universe. Based on the dynamics, we’d like to think SIMO could work. Firstly, the current relative strength ratio is around 62% off the mid-point of its long-term range, increasing the potential of mean-reversion. Secondly, the relative strength ratio has also now dropped to levels last seen in late 2020 from where we saw a pivot. We wouldn’t be surprised to see a similar outcome once again.
StockCharts