PM Images/DigitalVision via Getty Images
Despite looking like secret alpha recipes, smart-beta investment strategies simply did not live up to expectations in a plethora of cases, which I have already discussed a few times in my ETF articles on Seeking Alpha. Momentum across simpler, top-heavy market-cap-weighted portfolios featuring bellwethers was too strong and almost unrivaled at times, especially with the pandemic and ultra-easy monetary policy tailwinds in the mix, while investors in typically costly, high-turnover smart-beta funds were nursing losses or watching their capital grow at a glacial pace at best.
However, last year, the proponents of old-school market-cap weighting had an excellent chance to learn the downsides and limitations of this approach, with the iShares Core S&P 500 ETF (IVV) and Invesco QQQ ETF (QQQ) having their pandemic-era gains crimped, while more sophisticated and often value-tilted, slow-but-steady strategies ultimately hit their stride, modestly rewarding investors, or at least not declining as deep as the market.
Today, I would like to provide an overview of the Invesco S&P MidCap 400 Revenue ETF (NYSEARCA:RWK), a passively managed ETF looking at the U.S. mid-cap equity echelon through the lens of revenues, not market values. My goal is to elaborate on the advantages of this vehicle that beat the S&P 500 ETF by almost 10% last year, also paying due attention to its downsides, to decide whether it is worth considering it now or not.
What do I like about RWK?
To begin with, according to the Invesco website, its investment strategy is to track the S&P MidCap 400 Revenue-Weighted Index, a recalibrated version of the S&P 400, with revenues being the key factor influencing a constituent’s weight; the 5% cap is also applied, most likely to ensure adequate diversification.
When it comes to advantages, RWK is hardly different from the Invesco S&P 500 Revenue ETF (RWL) which I discussed in January. Back then, I highlighted that revenue weighting means a greater influence of better-valued companies with immense sales (Walmart (WMT) is an excellent example here) but small revenue and earnings multiples on returns, which, in turn, is supportive of market-leading performance of such smartly weighted portfolios when bears are in control and growth premia are being decimated because of the sharply rising cost of capital; nevertheless, during recoveries, this tends to be more of a drag.
Expectedly, RWK has its valuation characteristics close to excellent as players with the largest revenues occupy the top spots. For better context, I created the following table comparing RWK’s key ten holdings’ weights and sales they delivered in the last twelve months to the same group within the SPDR S&P MidCap 400 ETF (MDY).
Created by the author using data from Seeking Alpha, RWK, IWV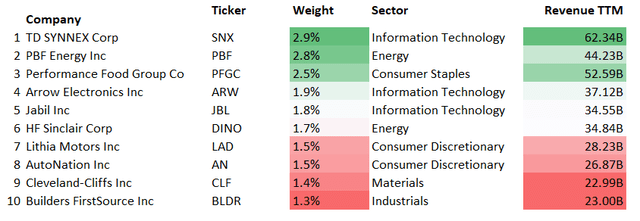
So, while TD SYNNEX Corporation (SNX), the IT player with the largest revenue in the entire S&P 400 index, has a 2.9% weight in RWK occupying the first line, in MDY, it accounts for measly 0.19%. Meanwhile, its key investment (0.8%) is Fair Isaac (FICO), a financial services company boasting a $17.2 billion market cap (rather generous by the mid-cap standards, I would say); RWK allocated only 7 bps to it.
Created by the author using data from Seeking Alpha and MDY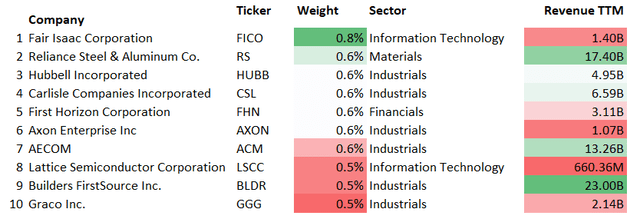
Since we are discussing the point that the value factor and revenue weighting schema are intimately intertwined, I should note that SNX has an A Quant Valuation grade, which is obviously not the case with FICO which is apparently overpriced even compared to the IT sector as the data below illustrate.
Seeking Alpha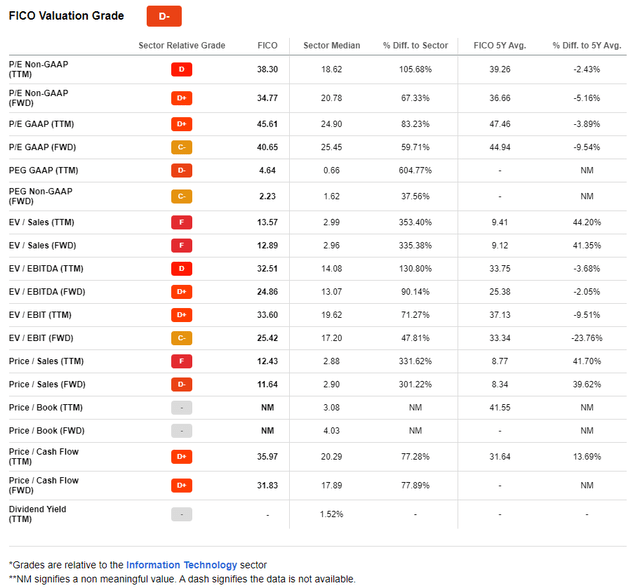
So, better valued names tend to climb to the top positions in revenue-weighted portfolios, while those with overstretched multiples have higher chances of becoming major positions in market-cap-weighted ones.
As RWK’s weighted-average market cap stands at about $6.97 billion, as per my calculations, vs. MDY’s about $7.2 billion, it is not surprising that its earnings yield is at 9% vs. the S&P 400 index’s 6.8%. It is again not by chance that over 56% of the holdings have a B- Quant Valuation grade or better vs. just ~29.6% in MDY.
Of course, uncompromising hardline value investors may point out here that the discount is too small, and a 1.2x weighted-average Price/Sales also looks a bit inflated. For them, I believe the Invesco S&P MidCap 400 Pure Value ETF (RFV) is a vehicle to consider, as when I discussed the fund in January, its earnings yield stood at 11%. However, they should understand that the higher the earnings yield, the weaker the profitability profile; we will return to that shortly.
Next, RWK’s returns are surprisingly robust. The period I decided to take a closer look at is June 2019 – January 2023 as in May 2019, Invesco (IVZ) acquired MassMutual asset management affiliate OppenheimerFunds, with the reorganization of the Oppenheimer S&P 400 Revenue ETF following.
Here, it beat RWL, MDY, and even IVV, trailing only Invesco S&P SmallCap 600 Revenue ETF (RWJ) that delivered astounding 52.6% total return in 2021 bolstered by the capital rotation, which is the most significant contributor to its CAGR shown below.
| Portfolio | RWK | MDY | IVV | RWL | RWJ |
| Initial Balance | $10,000 | $10,000 | $10,000 | $10,000 | $10,000 |
| Final Balance | $18,071 | $15,368 | $15,728 | $16,754 | $21,473 |
| CAGR | 17.51% | 12.43% | 13.15% | 15.11% | 23.17% |
| Stdev | 28.18% | 23.33% | 19.69% | 20.14% | 32.28% |
| Best Year | 33.90% | 24.21% | 28.76% | 29.82% | 52.56% |
| Worst Year | -8.19% | -13.28% | -18.16% | -6.02% | -10.97% |
| Max. Drawdown | -36.33% | -29.63% | -23.93% | -24.12% | -37.95% |
| Sharpe Ratio | 0.68 | 0.58 | 0.67 | 0.75 | 0.77 |
| Sortino Ratio | 1.05 | 0.86 | 1.04 | 1.2 | 1.33 |
| Market Correlation | 0.92 | 0.95 | 1 | 0.96 | 0.81 |
Created by the author using data from Portfolio Visualizer
To contextualize, during these 44 months, RWK grossly outperformed MDY, beating it 28 times; its returns were only softer during pandemic-torn 2020 when it trailed the S&P 400 ETF by about 2.7%. Uncoincidentally, in 2022, it underperformed its simpler peer only four times, namely in June, July, September, and December.
Created by the author using data from Portfolio Visualizer
What is RWK’s Achilles heel?
There are a few notable disadvantages investors should ensure they understand before going long RWK.
Expectedly, the mid-cap mix has a few vulnerabilities in terms of quality. In fact, it is not as burdened by low-quality stocks as RFV, for example, yet only 61% of the holdings have a B- Profitability grade or higher vs. 73.6% in MDY, so the risks related to weak margins and inadequate capital efficiency are a bit higher.
Another remark worth making is that RWK portfolio has a large spread between weighted-average Return on Equity and Return on Assets, as per my calculations, ~26% vs. 6.8%, pointing to the debt issue (large borrowings reduce book value and inflate ROE) likely being the top contributor to elevated ROE. Upon deeper inspection, I found out that 42% of the firms (ex-financials) have a Debt/Equity of 100% or higher, so the result is obviously skewed.
Also, investors who are for whatever reason skeptical about top-heavy portfolios should note that the major ten holdings account for over 19% in RWK and only 5.6% in MDY.
Besides, another issue with the fund is its relatively high expense ratio of 39 bps; however, liquidity looks adequate.
Final thoughts
RWK is a smart-beta investment vehicle with an emphasis on mid-caps with larger revenues. In the current iteration, it is overweight in the consumer discretionary (23.6%), industrials (19%), and IT sectors (14.3%); MDY favors industrials (over 20%), financials (14.9%), and consumer discretionary (14.5%).
RWK should appeal to value investors seeking a combination of comparatively adequate multiples and decent quality in the mid-cap echelon. As we have seen in the case of RFV, maximalist value investing in most cases means overweening exposure to companies with utterly lackluster profitability. RWK has an edge here as it has comparatively adequately balanced both.
RWK delivered excellent returns in the past as illustrated above but unfortunately, I am not convinced enough as I personally would like to see a better quality profile. So, RWK earns a Hold rating.


