Bill Oxford
Thesis
The PIMCO Dynamic Income Fund (NYSE:PDI) is currently paying a dividend yield of 13.6%. So, you must be wondering what my title meant by saying it is not enough. First, let me start by clarifying what I did not intend to mean. I did not intend to argue that 13.6% is a low yield. It is truly mouthwatering and offers a substantial income for income investors.
What I mean by this title – and will elaborate in the remainder of this article – is mainly twofold. Firstly, I will argue that such a yield is not enough to make the fund attractive in terms of total returns in the long term. Secondly and more importantly, I will argue that such a yield is not enough to compensate for the risks under current conditions.
The first argument should be relatively easy to make. All we need to do is to compare its total return against some other benchmark over a reasonably long period. The question here is, of course, which benchmark to choose. The chart below shows three choices. It shows the total return performance of PDI compared to the SPDR® S&P 500 ETF Trust (SPY), as an approximation to the overall equity market – probably an unfair benchmark given that SPY is not famous for paying high dividends. Then it also shows the performance of the Utilities Select Sector SPDR® ETF (XLU) and the Staples Select Sector SPDR® ETF (XLP), two sectors famous for generating boring and steady income.
As seen, in a 3-year period, the PDI fund significantly underperformed all these choices in total return. You can pick other periods of reasonable length, and chances are you will see the same underperformance.
Seeking Alpha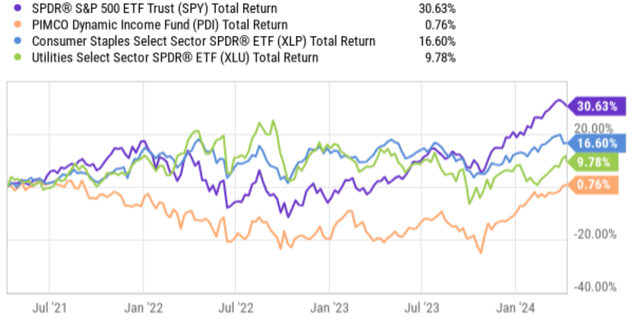
Fund description and exposures
My second is more involved. To assess the risks underlying PDI, we will have to dig into its holding and see its detailed exposures. If you are reading this, you must know that the fund primarily invests in debt obligations (in case you don’t, see the fund description below and the emphases were added by me):
The fund normally invests worldwide in a portfolio of debt obligations and other income-producing securities of any type and credit quality, with varying maturities and related derivative instruments. The fund’s investment universe includes mortgage-backed securities, investment grade, and high-yield corporates, developed and emerging markets corporate and sovereign bonds, other income-producing securities and related derivative instruments.
Among all the items highlighted above, mortgage-backed securities are its largest exposure by duration adjusted weight (“DWE”) as seen in the chart below. These assets represent more than 58% of its total assets in DWE terms.
PDI fund description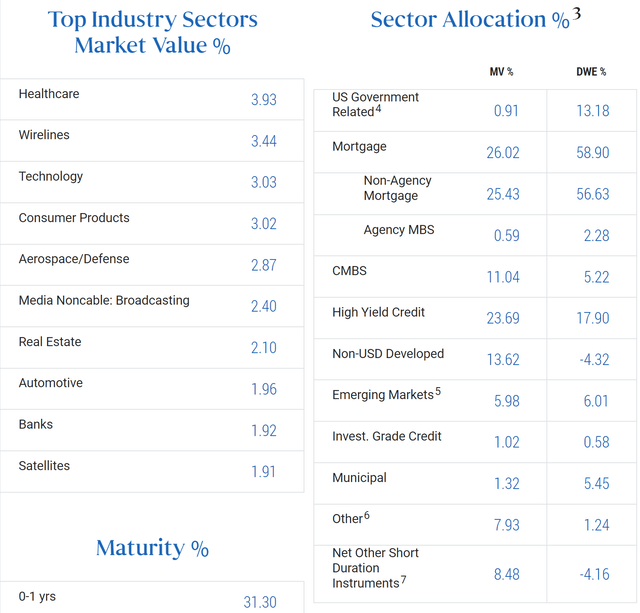
This is simply too large a risk in my view given our current conditions. I have a quite gloomy view of the mortgage REIT sector for various reasons that can fill multiple standalone articles. Here, I will try to be as brief as I can.
The essence of my chain of logic is elementary. First, I expect high borrowing rates and mortgage rates to persist or even worsen given the latest CPI data. JPMorgan (JPM) CEO Jamie Dimon commented that rates could go to 8%, and I see this possibility, too. With elevated inflation, then the logical second step in my mind is that consumers begin to have affordability issues.
More specifically, I expect debt delinquencies and default rates to be on the rise, let alone the origination of new loans. I have already begun to see these concerns materializing under current conditions, and I expect things to become even more challenging as high rates and high inflation drag longer. For example, you can read this report on the latest credit card and mortgage data (the quotes were slightly edited, and the highlights were added by me).
Credit card delinquency rates reached their highest level on record in Q4 2023, according to a report from the Federal Reserve Bank of Philadelphia, while new mortgages appear to be riskier amid rising housing costs… Meanwhile, mortgage originations declined to a series low in Q4 as market headwinds continued to stifle demand, and the data hinted at a possible change in the risk approach of firms.
Risk premium is among the highest levels
Another main concern is the risk premium of high-yield debt. If you recall from PDI’s sector allocations above, most of its assets are below investment grades (and that is why the fund’s yield can be so high in the first place). The main assets with an investment grade rating or above are U.S. government-related debts (0.91% by market value and 13% when adjusted for duration) and a negligible amount of investment grade credit (around 1% by market value and 0.6% when adjusted for duration).
My opinion – as a precaution, it is a pretty strong opinion – is that now is among the worst of times to own non-investment grade debts judging by their risk premium relative to risk-free rates as shown in the chart below. The details are in my earlier article here, and I won’t dive in so much. I will just quote the result here:
The chart shows the yield spread between BAA bonds and 10-year treasury rates (US10Y) (which I use to represent risk-free rates). The yield spread is currently at 1.44% only as seen in the chart. Historically, the spread has been in the range of ~2% to 3.5% most of the time. The current spread is among the thinnest levels in the past 3 decades.
FRED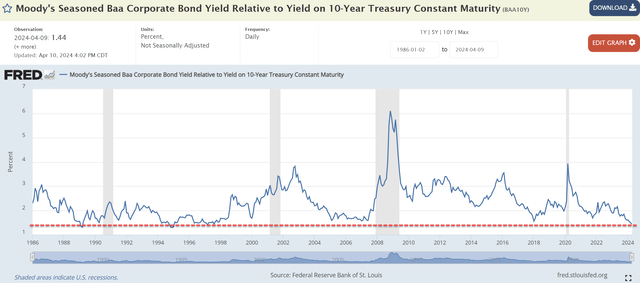
Other risks and final thoughts
Due to such an extremely thin yield spread, PDI’s (and similar funds like PTY) yield is actually not that attractive by historical standards, despite the attractiveness of their yield in absolute terms. The chart next compares the dividend yield from the PDI against two comparable funds, PIMCO Corporate and Income Opportunity Fund (PTY) and XLU, and also their historical average yield. As seen, PDI’s current dividend yield (TTM) is 13.6% and its 4-year average Yield is 13.43%. Its current yield is only 1% above the historical average. PTY’s (PDI’s system fund that also focuses on high-yield debt) is currently 9.65% and is lower than its 4-year average of 10.29%. In contrast, simple vanilla ETFs like XLU and XLP, which are known for their steady dividends, are currently yielding higher than their historical average by a good margin. As seen, XLU’s current yield of 3.36% is about 8% above its 4-year average of 3.12%. As seen, XLP’s current yield of 2.83% is about 11% above its 4-year average of 2.54%.
Seeking Alpha
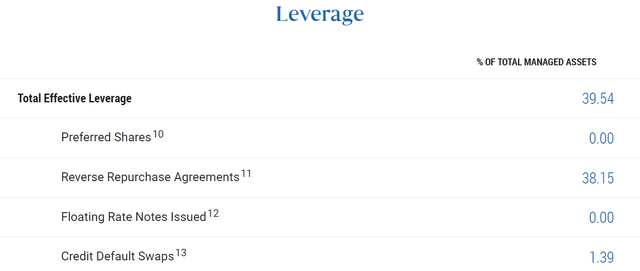
On the upside, the fund can win on multiple fronts in the case of a soft landing. Of course, a soft landing will help all equity valuations, but it will help funds like PDI more dramatically because of its substantial leverage. The total effective leverage is almost 40% as seen in the chart below. In the case of a soft landing, recession does not occur and rates drop smoothly. This would help PDI in at least two ways: valuation expansion on its holdings and also reduced its interest expenses. The market is quite optimistic about the odds of the soft-landing scenario. However, once again, I share Dimon’s more gloomy view below:
… markets are pricing the chance of a soft landing, i.e., modest growth along with declining inflation and interest rates, between 70% and 80%. I believe the odds are a lot lower than that.
To conclude, the high yield from PDI is indeed very enticing. However, my view is that the yield is: A) not enough to make it competitive in terms of total returns; and B) not enough to compensate for the risk exposure of its underlying holdings. The fund can score big in the case of a soft landing due to its exposure to high-yield assets and use of leverage. But I think the market is overly optimistic about the odds of a soft landing.
PDI fund description