

Tast Nawarat
The Fed has conquered inflation. It’s time to start easing. The economy looks OK, no looming recession.
Chart #1
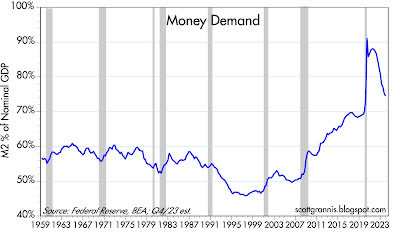
Chart #1 is arguably the most important chart that the market and the Fed have almost completely ignored for decades. Sure, everyone talks about the money supply (the best measure of which is M2), but no one talks about money demand. And as all students of economics should have learned, prices are set at the margin by the intersection of supply and demand. As Milton Friedman taught us, inflation happens when the supply of money exceeds the demand for it; so when there is an excess of money supply relative to demand, then prices rise and the value of the dollar declines. But without knowing money demand, which is half of the equation of inflation, we are in the dark when it comes to understanding inflation. To be fair to those who have ignored money demand, there is no direct measure of money demand. But we can infer what is happening with money demand if we just observe inflation: Rising inflation must mean that money demand is falling relative to money supply.
And as subsequent charts show, there are other ways of understanding what is happening with money demand.
Chart #2
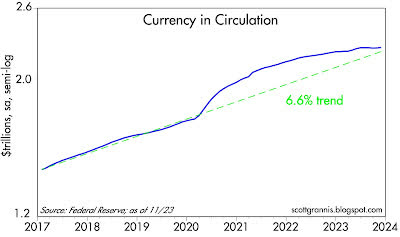
Chart #2 shows the amount of dollar currency in circulation (currency represents about 10% of M2). From 1995 through early 2020, money in circulation grew by a relatively constant 6.6% rate per year. This in fact is an excellent measure of money demand, because no one holds onto currency if they don’t want it, because there is an opportunity cost to doing so. If you handed me a suitcase full of $100 bills, I would rush to the bank to deposit the money in order to earn interest. And then, I would probably use some of the money to buy some stuff and invest in the stock market and/or real estate. In short, I have no need to hold tons of cash. But in the wake of the Covid crisis, the demand for dollar currency soared; everyone wanted to hold more cash because of all the uncertainty that prevailed at the time. Currency grew by a record 16.4% in the 12 months ended Feb. ’21. More recently, however, the demand for cash money has fallen rather significantly. Currency has increased at a mere 0.9% annualized rate in the 6 months ended Nov. ’23. Currency now is within spitting distance of its long-term growth trend. The surge in the demand for currency has almost completely reversed from its early-covid levels.
Rising money demand in 2020-21 kept the surge in M2 money from causing inflation. Falling money demand since 2021 has kept the decline in M2 money from causing deflation.
Chart #3
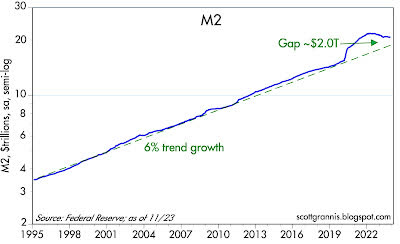
Chart #3 shows the level of M2. Here the story is similar to that of currency, only much more dramatic: M2 surged in the wake of Covid, rising by some $6 trillion (almost 40%) to a peak in late 2021. (As I have explained before, this surge in M2 was almost exactly equal to the increase in the federal deficit that was caused by $6 trillion of Covid-related “stimulus” payments.) Since its peak, the “excess” of M2 at its peak has fallen by 58%, and M2 now looks on track to return to its long-term trend line in a year or so.
Chart #4
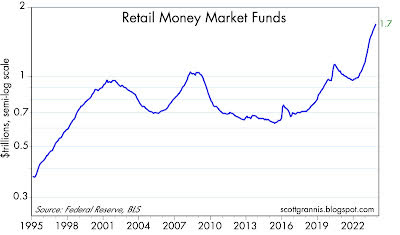
Chart #4 shows the level of retail money market funds, which now comprise about 8% of M2. Even as M2 started to decline early last year, retail money market funds began to surge, fueled by the sharp rise in short-term interest rates that resulted from Fed tightening. Virtually all of this increase was in fact money that moved out of traditional bank savings and deposit accounts as individuals were attracted to the much higher yields on money market funds, so this increase was not a sign of increased money demand. Instead, it is an excellent example of how rising interest rates can increase the public’s demand for certain forms of money.
Chart #5
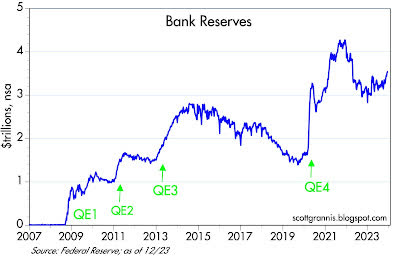
Chart #5 shows the level of bank reserves supplied by the Fed to the banking system. Bank reserves are not cash that can be spent anywhere, and they are only held by banks-in effect, they represent loans that banks grant to the Fed in exchange for reserves. Prior to late 2008, reserves paid no interest, and so banks held only the minimum amount of reserves necessary to collateralize their deposits. Since 2008, bank reserves have effectively become T-bill equivalents for the banking system. As the chart shows, reserves have rarely been more abundant. Banks’ balance sheets are thus loaded with high-quality, liquid, interest-paying debt. That in turn means that banks are effectively awash in liquidity. As I’ve argued before, abundant liquidity has made the current Fed tightening episode unique. In previous tightening episodes, the Fed actively restricted the supply of (non-interest paying) reserves in order to push interest rates higher, and that in turn aggravated credit conditions and helped tip the economy into recession. Not so today, thank goodness!
John Cochrane elaborates on this subject in his op-ed in Tuesday’s WSJ.
Chart #6
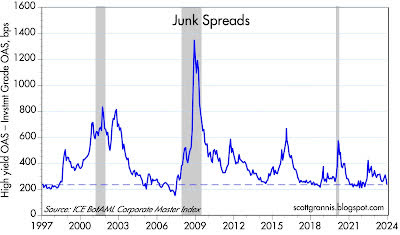
Chart #6 shows the so-called “junk spread,” which is the difference between the credit spread on high-yield vs investment-grade corporate bonds. Both nominal spreads and the difference between credit spreads are near all-time lows, which is unprecedented at a time when the Fed is no longer tightening and is instead poised to start lowering interest rates. This directly contradicts other “classic” recession predictors, such as the following chart. Monetary conditions are very different this time.
Chart #7
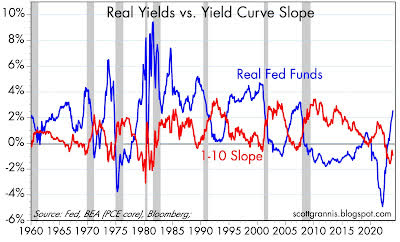
Chart #7 shows why many still worry about a looming recession. Note how every recession since 1960 was preceded by sharply rising real interest rates (blue line) and an inversion of the yield curve (red line). Today, we see rising real interest rates and a definite inversion of the yield. So does that mean a coming recession? Not necessarily.
As the discussion above highlights, not all Fed tightening episodes are the same. I’ve embellished on this many times in the past, noting that it’s not enough to have high real interest rates and an inverted curve to produce a recession: You also need to see high and rising credit spreads and a shortage of liquidity.
Chart #8
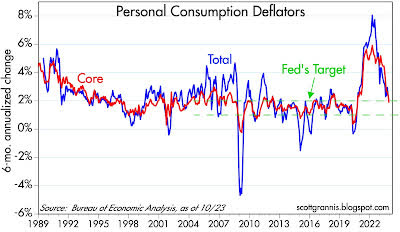
As Chart #8 shows, inflation as measured by the Personal Consumption Expenditure Deflators (a better measure of inflation than the CPI) has, over the past six months, fallen to 2% or less on an annualized basis. The Fed has succeeded in reaching its goal. Bravo!
Chart #9
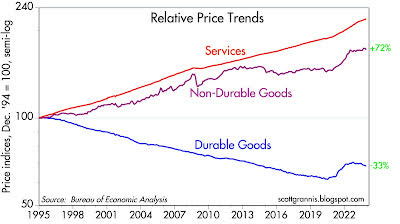
Chart #9 shows the three major components of the PCE deflator. Non-durable goods price inflation has been almost zero since mid-2022, while durable goods have experienced deflation over the same period. Only service sector prices (which are dominated by housing costs; see my previous post for an explanation) are rising these days, but the rise is exaggerated by flawed calculations.
Chart #10
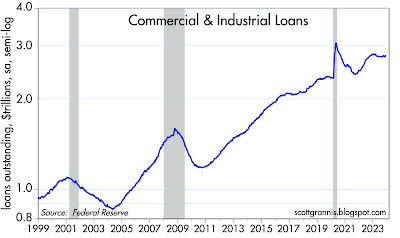
Chart #10 shows the level of Commercial & Industrial Loans by US banks. Loan growth has been almost non-existent in the past year (no doubt to high interest rates choking off demand for credit), and many analysts worry that this poses a threat to economic growth.
Chart #11
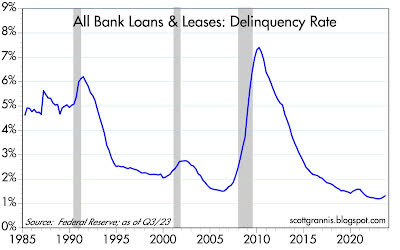
However, as Chart #11 shows, delinquency rates are near historic lows. Delinquency rates tend to rise as the economy nears recessionary conditions, but this is manifestly not the case today. Corporations are not struggling to pay outsized debts, and are thus much less at risk of having to tighten their belts. Mortgage delinquency rates are now below their pre-Covid lows. Private sector indebtedness is not a problem today. Public sector indebtedness, however, is another story, which I hope to address soon.
Chart #12
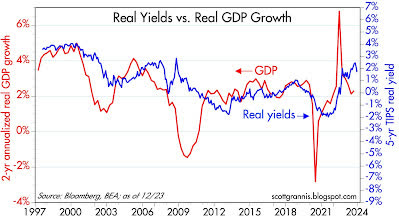
As Chart #12 shows, real yields tend to track real growth trends. With the economy likely growing by a little more than 2% per year (tepid by historical standards), real yields should be much lower than they are today. That will correct itself as the Fed eases.
The big question today: When will the Fed start lowering interest rates? Today, the bond market is betting it will happen at the March 20 FOMC meeting. In my experience, however, when the market becomes highly confident of something that is going to happen in 3 months’ time, the event usually happens sooner. Sometimes the future cannot wait very long to happen. I’d put some bets on an ease at the January 31st FOMC meeting.
Original Post
Editor’s Note: The summary bullets for this article were chosen by Seeking Alpha editors.


")


