monsitj
Most investors know what Dow numbers mean, but they don’t stop to ask themselves what 100 S&P 500 points are worth, which in many cases can be less than the weekly range of the index.
Care to know? 100 S&P points are worth about $1 trillion, or a tad more, but the numbers can be rounded that way, so the S&P 500’s advance since late October is worth a tad over $10 trillion.
While a 25% surge in the S&P 500 in four months sounds like a big rally, we were down over 10% in the previous three months, so it is not that big a move since July 31.
I saw some research that stocks have advanced as much (25% in four months) only eight times since 1930, either after a bad recession, when sharp rallies are normal, or at the start of a major bubble, as in early 1999.
This time around, we did not have an overall recession, even though some parts of the economy have definitely receded.
One economist called the last two years a “rolling recession,” where some major economic sectors experienced contractions, but because those contractions were not synchronized, the overall market held up without contracting.
It is entirely possible that this is what a “soft landing” looks and feels like. It could be that his stock market is partying like it’s 1999… or like it is 1995, the year of the rare soft landing of the economy under Alan Greenspan.
In other words, I don’t believe the overall stock market is overheated, even though certain individual stocks certainly are overheated.
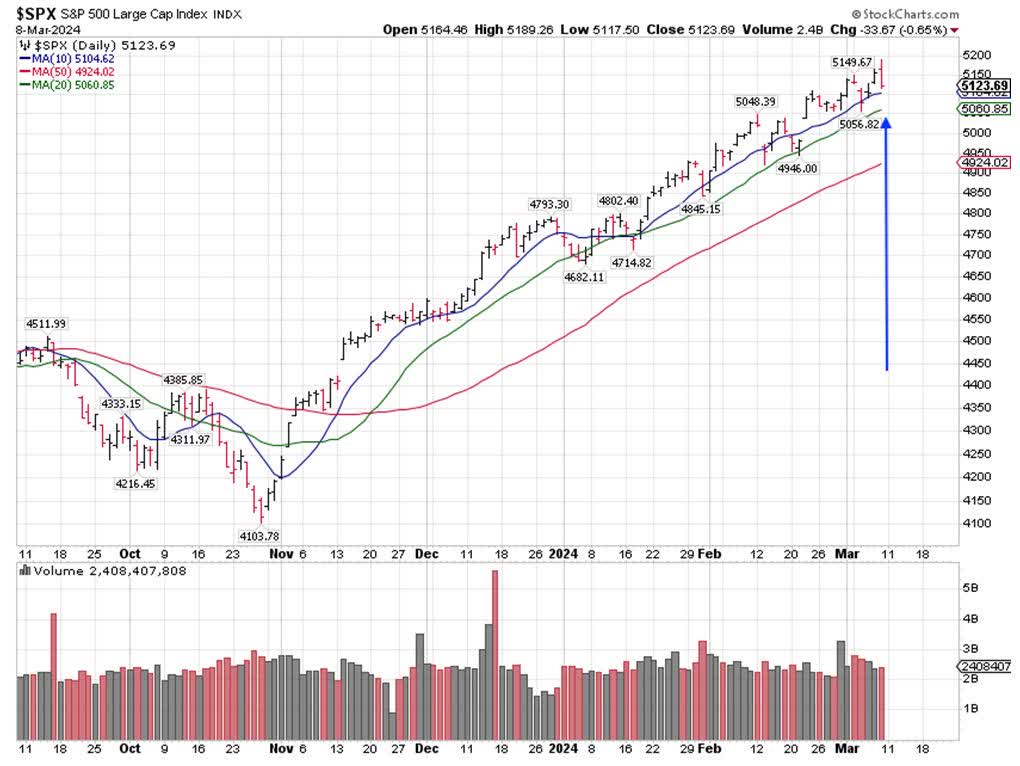
So far, the biggest correction that we saw in the rally since October 27 came in the four days between the last trading day of December and first three trading days in January, so it remains to be seen if we can decline that much or more now.

Graphs are for illustrative and discussion purposes only. Please read important disclosures at the end of this commentary.
I am writing this on Friday, March 8, as the stock market experienced a classic reversal, after it made a fresh all-time high on the S&P 500 and the NASDAQ 100 indexes early in the day, and then the indexes closed down on the day, below where they opened.
Such a large range during a single day is called a “bearish engulfing pattern” and may indicate the start of a bigger correction.
The key word here is “may,” as one day does not a trend make. So far, the typical pullbacks have been two days, with the largest being four days, so 2-4 days has been the norm so far in this rally.

Graphs are for illustrative and discussion purposes only. Please read important disclosures at the end of this commentary.
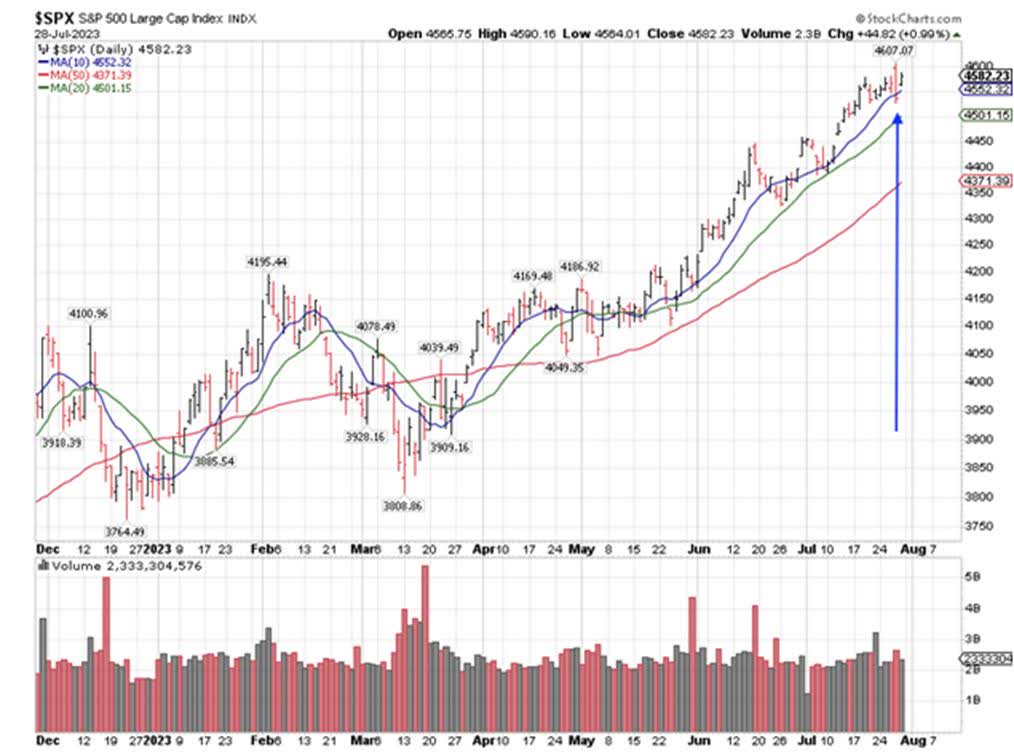
Such “bearish engulfing patterns” stand out to people that have been sitting in front of flat screens for 25 years – myself included. This is how the correction over the summer in 2023 started and I pointed it out back then (see reproduced chart above).
I thought back then that the S&P 500 could fall to 4400, and it ended up at 4100. When corrections start, we don’t know for sure, ahead of time, when they will end.
This time, I don’t think we will have a big correction if we get outside of the 2-4-day window at all, as the rally has been broadening out and the average stock is acting well (that was not the case last summer).
Seasonally speaking, March-May has not been the season for big corrections. February has a bad seasonality pattern, but as you can see this past February turned out just fine.
Seasonality is not a guarantee, just a guideline, and one could conclude that if the market sails through a poor seasonality period well, it might react to good seasonal patterns even better come spring.
All content above represents the opinion of Ivan Martchev of Navellier & Associates, Inc.
Disclaimer: Please click here for important disclosures located in the “About” section of the Navellier & Associates profile that accompany this article.
Disclosure: *Navellier may hold securities in one or more investment strategies offered to its clients.
Original Post
Editor’s Note: The summary bullets for this article were chosen by Seeking Alpha editors.


