

Dilok Klaisataporn
The following is an overview of the market cycle as it stands at the beginning of Q1 2024. We will focus on the core of the cycle—corporate earnings—and work our way out in order to gain a comprehensive view of markets across asset classes. This will help organize our analysis over the coming quarter. Generally, however, a disinflationary downcycle remains intact. This is favorable for Treasuries, unfavorable for commodities, and dangerous for equities.
Defining Market Cycles
First, a brief word on how “the market cycle” is defined here, which will help set up the order in which the key variables will be analyzed. Based on historical analysis, in many cases going back a century and a half, there are a number of key variables that move in a cyclical fashion and tend to be correlated with one another (although there are relatively regular leads and lags to those correlations). Using 16-month rates of change (or more smoothed versions using rates of change relative to a 36-month moving average or similar, but more complicated, statistical techniques) appear to reveal information about future changes of that given variable as well as other cyclical variables. This has been discussed in greater detail in my articles focused on specific commodities and Treasuries.
Why given variables are more correlated with one another or why the 16-month rate of change appears to be more meaningful than others are interesting topics but remain shrouded in mystery. But, these relationships appear to be rather consistent and somewhat predictive, so it is important to keep track of them when looking forward to the future, and for thinking about how markets actually function in contrast to what economic theory might say.
As mentioned above, corporate earnings for the market as a whole appear to be the core variable. Following earnings in importance is industrial metals prices, because industrial metals cycles are consistently correlated with earnings cycles, but there is a lag in the release of earnings data whereas commodities prices are real time. So, analytically, industrial metals are as important as corporate earnings in cycle analysis.
Beyond earnings and industrial metals prices are commodity prices generally, with some commodity classes being more correlated with the core cycle than others. Precious metals tend to lead the cycle; raw materials (like cotton) tend to move with the cycle; grains tend to slightly lag; and energy (most notably crude oil) lags grains. Fertilizers tend to fall in between grains and energy. Other food and beverage commodities are much more irregular (cocoa is a particularly troublesome example), but over the long term, they tend not to wander too far from the total market cycle.
Then, there are long-term interest rates, which have a tendency to lag. Short-term interest rates are not as closely tied to the market cycle and seem to bridge the market cycle and the “business cycle” (the expansion and contraction of real GDP primarily). Consumer inflation, particularly services inflation, and GDP are in a much wider orbit of the market cycle. Similarly, stock prices appear to have an orbit that is impacted by forces that are not primarily cyclical (this has been discussed extensively in other articles, such as those here). In fact, when it comes to tracking stock cyclicality, it is best to use trend analysis rather than momentum analysis.
These fundamental, core relationships can be summarized in the following charts. The first shows idealized oscillations in the rates of change of commodities, S&P 500 trailing twelve-month earnings, and long-term interest rates.
Chart A. Rates of change in earnings, commodities, and interest rates tend to move together. (Author)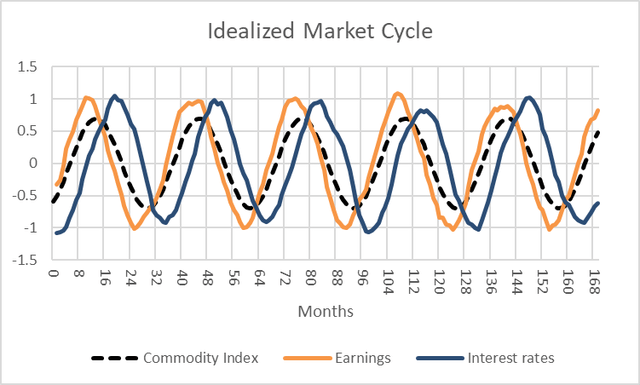
The second chart shows the idealized structure of the market cycle, with earnings at the core and GDP and stock returns being the most peripheral.
Chart B. The core of the market cycle is earnings and industrial metals. (Author)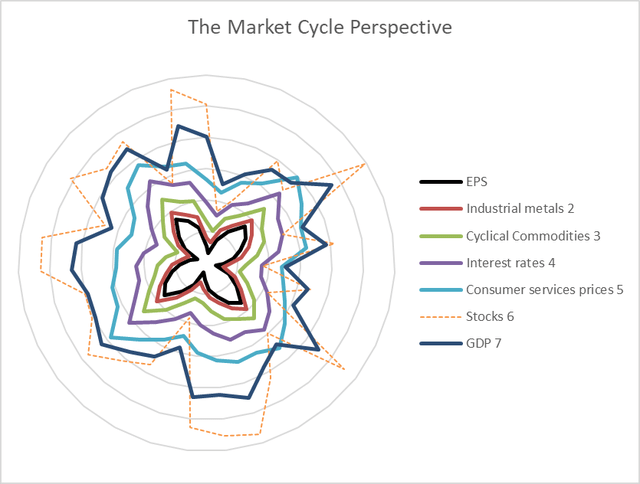
So, we are going to move from the core to the periphery, primarily using log rates of change relative to 36-month moving averages, except for stocks.
First, earnings and commodities.
The Market Cycle Core
Industrial metals are clearly in a downcycle, as are corporate earnings, although at a much higher trough than the metals, which accounts, along with the high level of services inflation, for the stock market’s resiliency (as suggested by the Gibson Effect).
Chart C. Cycles in S&P 500 earnings and industrial metals prices tend to be correlated with one another. (World Bank; S&P Global; Robert Shiller; Author calculations)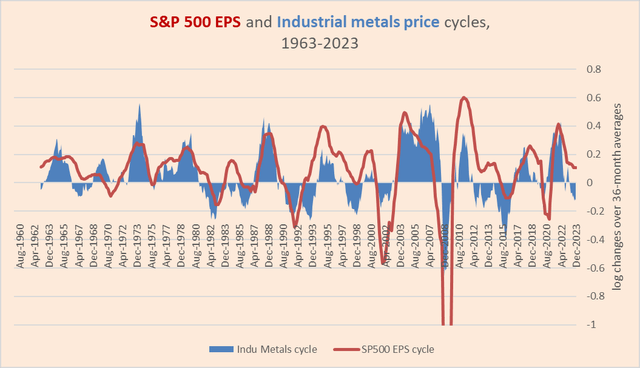
We can then take the same chart and add the overall commodity cycle.
Chart D. Commodity cycles overall tend to be correlated with the earnings cycle, as well. (World Bank; S&P Global; Robert Shiller; Author calculations.)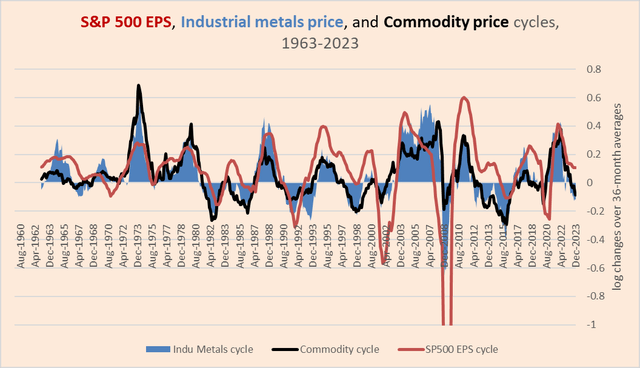
This seems to confirm an overall downtrend.
We can then zoom in and expand the universe of variables.
Chart E. All cyclical commodities have been decelerating over the last two years. (World Bank; S&P Global; Robert Shiller; Author calculations)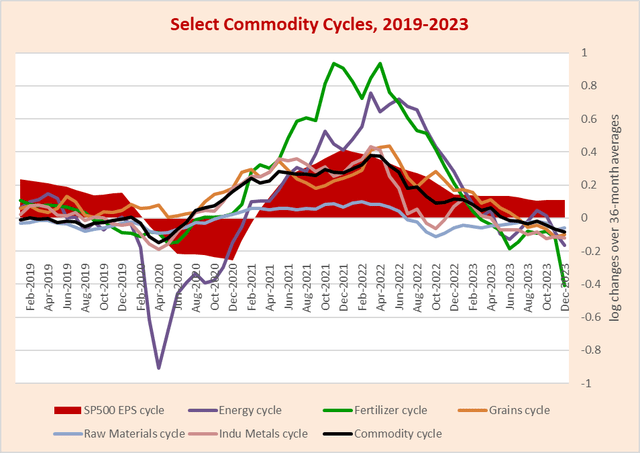
Although any single variable can be volatile, generally they are near-unanimous in their downtrend.
Let’s add the interest rate cycle to the mix.
Chart F. The interest rate cycle experienced its greatest divergence from the market cycle since the early 1980s. (World Bank; S&P Global; Robert Shiller; St Louis Fed; Author calculations)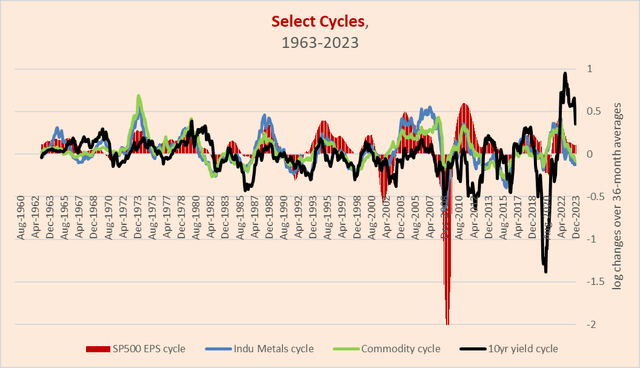
So, here we can see that the interest rate cycle has diverged sharply from the market cycle, perhaps to the greatest degree since the early 1980s, when we last saw a disinflationary cycle combined with interest rates ‘higher for longer’.
It is worth noting that even interest rates have diverged from the interest cycle, as the cycle (as defined here) has been in general decline since late 2022 but interest rates only peaked (assuming that was the peak) in late 2023.
Chart G. The interest rate cycle experienced its largest divergence from interest rate levels in the last 50 years. (St Louis Fed; Author calculations.)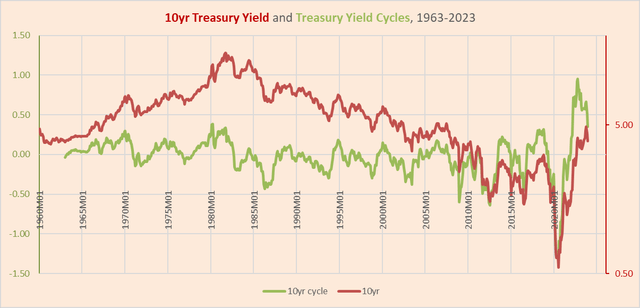
Here is another zoomed-in view.
Chart H. The interest rate cycle appears to be reconverging with the market cycle. (World Bank; S&P Global; St Louis Fed; Author calculations)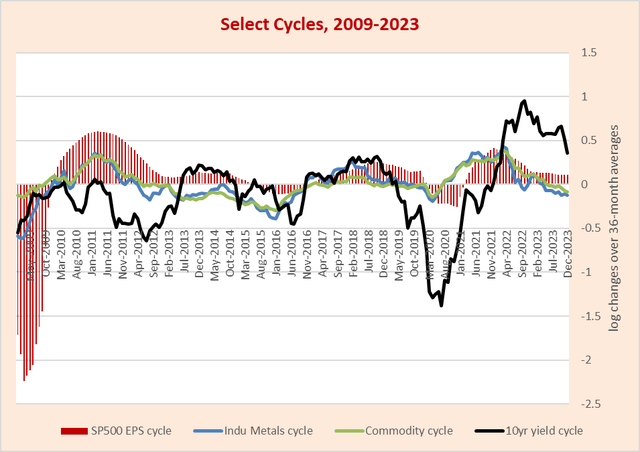
Interest rates are clearly linked to the core market cycle but are not slavishly obedient to it.
All in all, the market cycle is in a disinflationary downtrend, and this is feeding into more peripheral elements like consumer prices and GDP.
The Market Cycle Periphery
Below is a zoomed-in chart of consumer price variables.
Chart I. Consumer inflation is in steady decline. (St Louis Fed; Author calculations)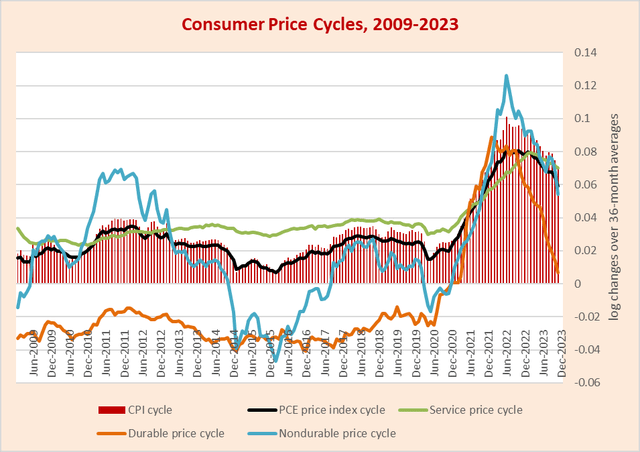
Goods inflation has fallen considerably since 2021, and services inflation peaked in late 2022.
Production cycles are even more loosely connected to the earnings cycle, but they are also in a downtrend.
Chart J. Earnings cycles and production cycles tend to only be correlated during crises. (St Louis Fed; S&P Global; Robert Shiller; Author calculations)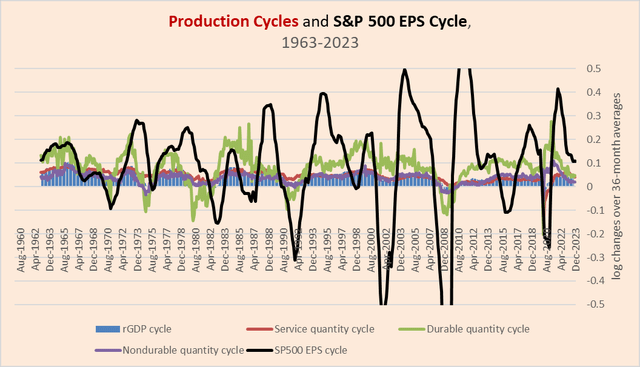
Finally, it is time to shift our attention to equities.
The Market Cycle in Stocks
Cyclical moves in the earnings yield (the inverse of the price/earnings ratio) tend to be driven by changes in earnings rather than changes in stock prices, whereas supercyclical changes in the earnings yield tend to be driven by changes in stock prices. Therefore, over cyclical durations, the earnings yield tends to move with the market cycle in a manner similar to commodities.
The chart below shows absolute levels of the S&P 500 earnings yield alongside cyclical changes in the commodity/Treasury ratio, and cyclical changes in consumer services prices, the primary component in consumer prices. It is extremely unusual for consumer prices to lead the market cycle, and typically they lag.
But, levels of the earnings yield and the cyclical momentum in the commodity/Treasury tend to move together.
Chart K. The earnings yield tends to be correlated with the market cycle, while services inflation tends to lag. (World Bank; St Louis Fed; S&P Global; Robert Shiller; Author calculations)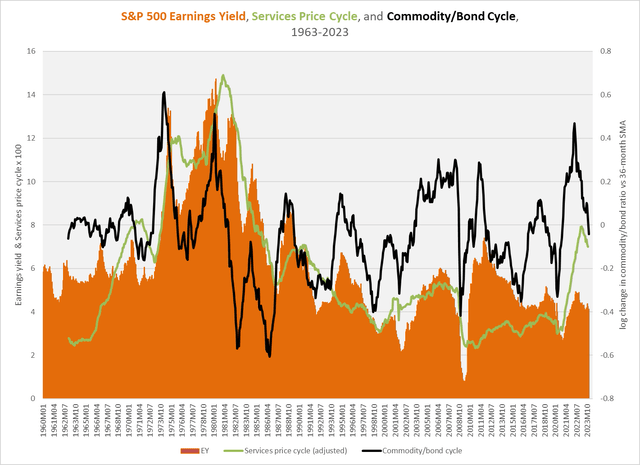
Sometimes stocks are extremely sensitive to the market cycle (as in 2008-2009) and other times, they behave in contracyclical ways (as in 1984-1986), rising as inflation and earnings momentum falls.
Their peculiar nature means that their cyclical momentum has to be measured in a different way. In the chart, I take the total returns of the SPY and some of the most highly cyclical sectors—XLY, XLB, XLI, and XLE—and create combined measures of their respective momenta and strength relative to long-term Treasuries.
Chart L. Equities remain buoyant. (Tiingo.com; Author calculations)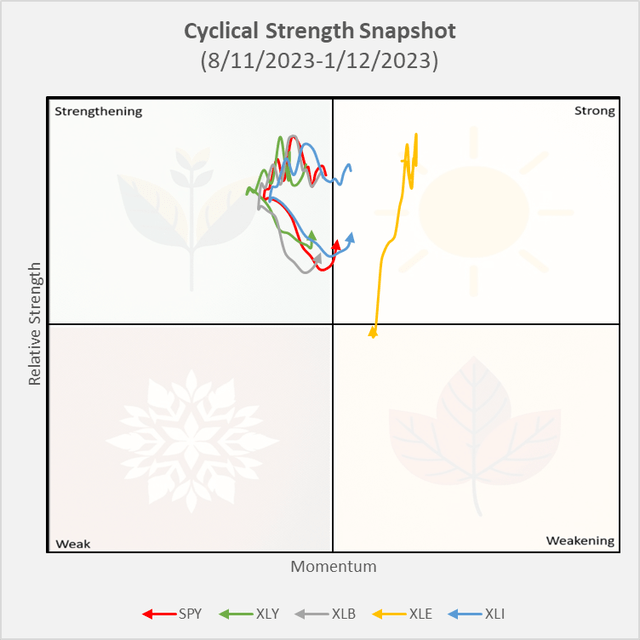
For an extended period of time, except for a recent decline in XLE’s position, stocks have consistently beat Treasuries, as illustrated by their positions above the horizontal line in the middle of the chart. Although they lost some momentum late last year, as with conditions in the fall of 2022, this proved to be mostly a buying opportunity.
The following chart illustrates much the same story in a somewhat different way. Here, I have created an equal-weighted index of XLB, XLI, and XLE (that is, “Cyclicals”) and the ratio of that index to four Treasury bond ETFs (SHV, SPTI, IEF, and ZROZ). Behind that ratio, I have calculated what I believe is the appropriate moving average for such ratios.
Chart M. Cyclical sectors continue to beat US Treasuries (Tiingo.com; Author calculations)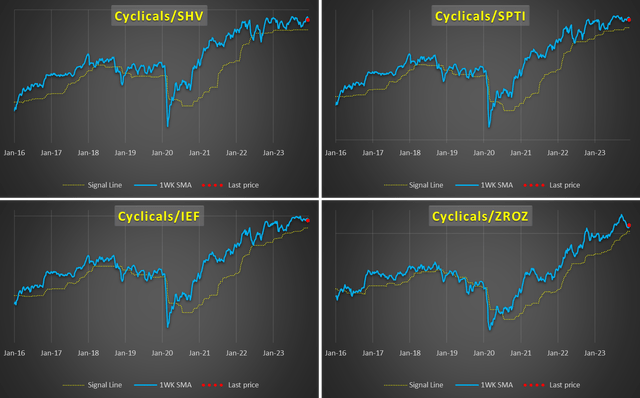
As you can see, cyclical sectors have lost some momentum relative to short-term Treasury ETFs like SHV and SPTI and longer-term Treasury ETFs like IEF and ZROZ, but the trends remain intact.
In sum, it appears that the downcycle that began in commodities and corporate earnings in early 2022 remains intact and has been followed by a deceleration in long-term Treasury yields, not to mention consumer inflation cycles. It is only in the last few months that we have seen Treasury yields begin to “catch up” with their own momentum, as well as the momentum of the market cycle.
Conclusion
In an upcoming piece, I will argue that Treasury yields are likely to decline in a sustained and significant fashion this year, and that this next phase of the downturn is likely to begin in the next few months, if not in a matter of weeks. But, that leaves the question of how stocks will respond, both on an absolute and relative basis. Recent history (the last two decades especially) has pointed to a tendency for stock/bond ratios to follow the market cycle. That is, when yields and commodities decline, stock/bond ratios decline, as well, as in the 2018-2019 period leading up to the Covid crash.
The most unusual thing about the current cycle, particularly since the peak of commodities and earnings momentum two years ago is the degree to which interest rates have refused to follow suit, even though interest rate momentum has. This has contributed to a major divergence between the core of the market cycle (earnings growth and commodity inflation) on one side and the periphery of the market cycle (interest rates and stocks) on the other.
The expectation remains that yields are going to turn down decisively and bring stock returns with them; thus, the best place to be is likely long-term Treasuries. But, monitoring the state of the cycle across all asset classes and pertinent macro-variables will be key.
")


