

BlackJack3D
While the iShares Biotechnology ETF (NASDAQ:IBB) has rallied in the last two quarters, it has lagged the broader markets significantly and remains in the range set last year. This makes it look “cheap” compared to other sectors, but as this article explores, stocks are usually cheap for a reason and IBB is a Fund to avoid for now.
Biotech Out of Favour
Biotech has been a lagging sector over the last five years, and especially since the late 2021 top. It has significantly underperformed the broader market (SPY) and Healthcare (XLV).
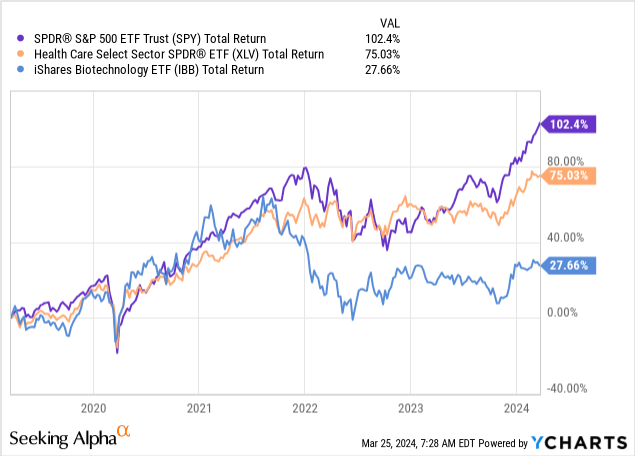
Despite the poor returns, IBB still has a lofty PE ratio of 26. It used to have an even higher ratio, but this was justified when IBB was considered a growth sector back in 2010-2015. This is no longer the case as IBB’s largest holdings have matured and revenues have largely stagnated.
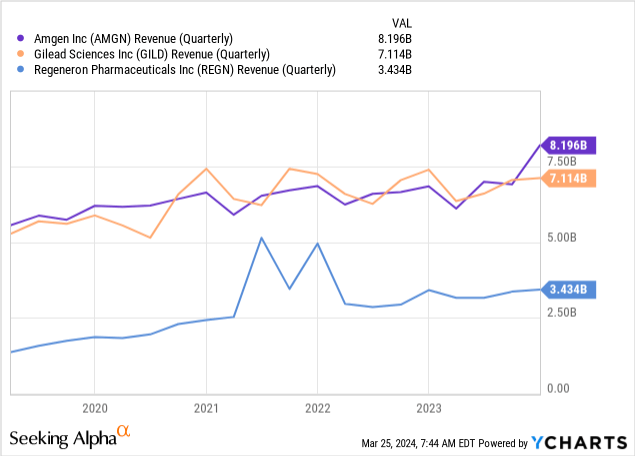
IBB is a passively managed fund which seeks to track the investment results of the NYSE Biotechnology Index. It has a total of 226 stocks in its portfolio, but over half its AUM is in the top 10 and in underperforming stocks such as Gilead which has been making lower highs since 2015.
IBB Top 10 Holdings (Seeking Alpha)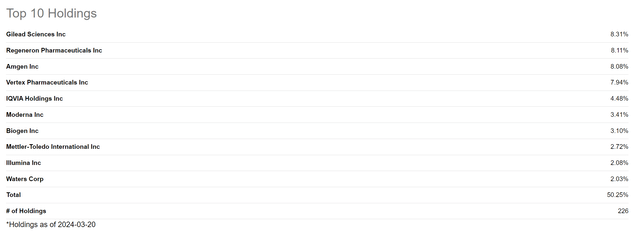
On top of flat earnings, sentiment has been poor in some of the stocks in this sector. IBB’s sixth largest holding, Moderna (MRNA), has experienced both a boom and bust cycle since the onset of Covid-19 and the chart shows a classic burst bubble.
MRNA Boom/Bust (Tradingview)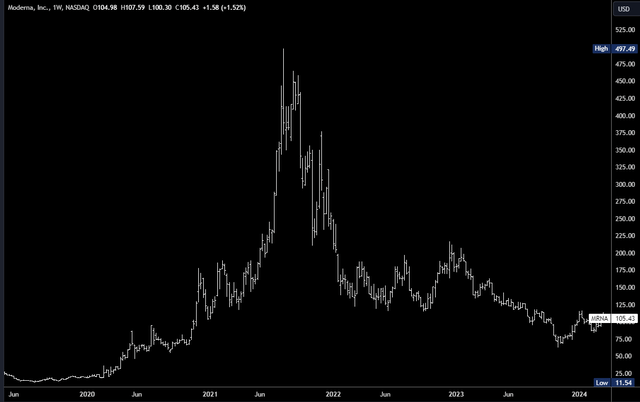
The decline since 2021 will have left a lot of disgruntled investors underwater and the “bust” cycle tends to take a long time to repair and for a new uptrend to develop.
One other headwind for IBB may come from the composition of the portfolio. With 226 stocks, there are naturally a lot of small caps. The top 100 holdings make up around 94% of the portfolio, while the remaining 6% is composed of 126 stocks with market caps of $1-2B or less. They are not given much weight but these are volatile holdings and not something many investors would choose to buy.
Stock Market Cycles
Markets either trend or consolidate depending on a variety of inputs. Even the strongest trends need to correct and allow positioning to reset and earnings catch up with stretched valuations. The IBB trend was incredibly strong from 2008-2015 as prices shot from $19.05 to $133.60, a gain of 601%. This was followed by a correction, and the rally has since struggled to hold on to gains. The closing price last week was just $2.65 higher than the 2015 high.
IBB Long-term Chart (Tradingview)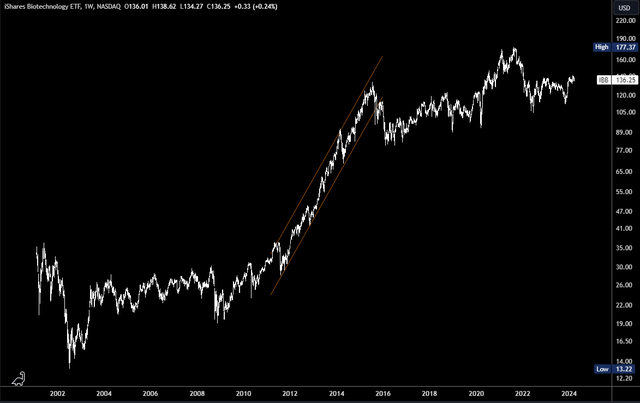
The price action since the 2015 top suggests the trend has been slowly coming to an end and a new correctional phase is underway. This is backed up by a large-scale topping pattern (head and shoulders).
IBB H+S Pattern (Tradingview)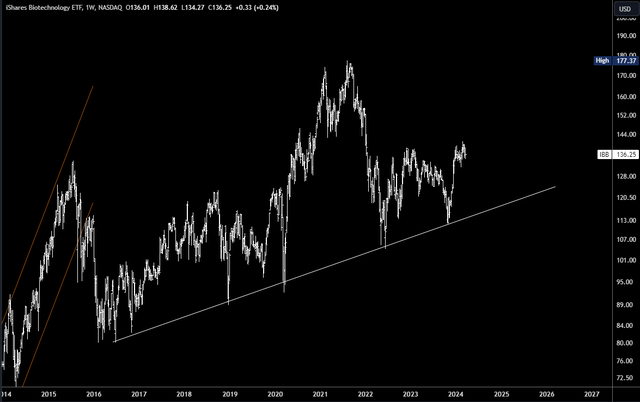
A correction should be healthy in the long-term, but a trend of 19 years may need a long time to correct and set up a fresh trend. If the head and shoulders were to trigger with a move through $120, it could target $100, even $80 over the coming years. This lower target does look unlikely, however, as Biotech is a sector which should have fairly stable earnings. I’d expect the $100 area to survive any large correction.
Such a large scale correction may seem unlikely, but an example of this comes from one of IBB’s main holdings, Gilead (GILD). The strongest part of its uptrend took place from 2010-2015 and it has been drifting sideways for around nine years.
GILD Chart (Tradingview)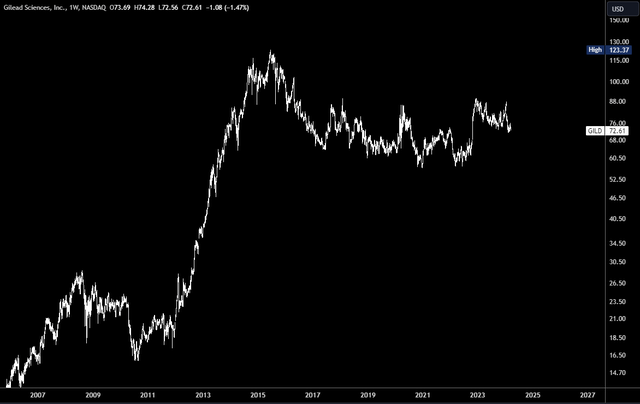
This is still a bullish chart in the long-term and the pattern can be considered a “bull flag.” However, it illustrates how even a bullish stock can go sideways for nine years.
Risks
This article posits IBB is an avoid or buy on a large correction as it is likely to consolidate sideways for a long period. However, there is a risk the correction is already complete and IBB starts a new uptrend. Again, I think the gains on this may be limited due to flattish earnings, but if the rally can break above $141-143, it could go on to test the all-time high of $177.
Conclusion
IBB provides broad exposure to the Biotechnology sector through a portfolio of 226 stocks. This has been an underperforming sector for many years now and with a PE ratio of 26 and flat earnings for the heavily weighted top holdings, it seems this could continue. However, the downside should be limited as the froth in stocks such as MRNA has been reset and revenues are relatively stable. A large sideways range could develop over the coming years.


")


")


