

PeopleImages/iStock via Getty Images
Investment Thesis
iShares Core S&P Mid-Cap ETF (NYSEARCA:IJH) warrants a buy rating due to its low-cost ability to capture the growth potential of a diversified mix of over 400 mid-cap holdings. Despite its comparative underperformance, lowering interest rates and the high valuation of large and mega-caps currently may make mid-cap stocks a desirable option this year. Furthermore, IJH has the most attractive valuation metrics in comparison to other top peer mid-cap ETFs.
Fund Overview and Compared ETFs
IJH is an ETF that seeks to track the results of an index composed of mid-cap U.S. equities and is focused on long-term growth. With its inception in 2000, the fund has 405 holdings and $78.34B in AUM. IJH has the greatest sector weight on industrials (21.58%), followed by financials (15.73%) and consumer discretionary (15.69%).
For comparison purposes, other mid-cap ETFs examined are Vanguard Mid-Cap ETF (VO), Schwab U.S. Mid-Cap ETF (SCHM), and Invesco S&P Mid-Cap Quality ETF (XMHQ). VO seeks to track the CRSP U.S. Mid Cap Index and to capture the performance of diversified mid-size companies. SCHM seeks to track the total return of the Dow Jones U.S Mid-Cap Total Stock Market Index. The fund aims to provide a low-cost method to achieve long-term growth through U.S. mid-cap equities. XMHQ is based on the S&P MidCap 400 Quality Index. The fund is rebalanced semiannually based on three proprietary factors. It is heaviest on industrials (29.66%), followed by consumer discretionary (17.41%) and information technology (15.37%).
Performance, Expense Ratio, and Dividend Yield
IJH has a 10-year compound annual growth rate, or CAGR, of 9.21%. By comparison, VO has a 10-year CAGR of 9.50%, XMHQ has a 10-year CAGR of 11.49%, and SCHM has a 10-year CAGR of 8.89%. Of note, all of these mid-cap ETFs have underperformed the S&P 500 Index’s 10-year CAGR of over 12%. However, due to high returns from large and mega-cap stocks recently, mid-cap is comparatively undervalued. Additionally, the anticipated reduction of interest rates will make many mid-cap holdings an attractive category for investment this year.
10-Year Total Price Return: IJH and Compared Mid-Cap ETFs (Seeking Alpha)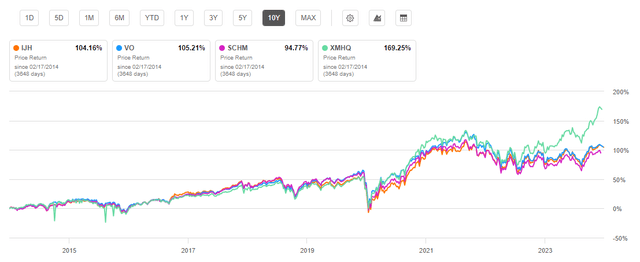
IJH has a very low expense ratio at just 0.05%. However, compared mid-cap funds, VO and SCHM, are even lower at 0.04%. IJH also has a noteworthy dividend yield at 1.43%. This is the highest of peer funds except for SCHM. Additionally, IJH’s dividend yield is growing with a 7.22% 5-year CAGR.
Expense Ratio, AUM, and Dividend Yield Comparison
IJH | VO | SCHM | XMHQ | |
Expense Ratio | 0.05% | 0.04% | 0.04% | 0.25% |
AUM | $78.34B | $152.91B | $10.96B | $3.59B |
Dividend Yield TTM | 1.43% | 1.16% | 1.48% | 0.66% |
Dividend Growth 5 YR CAGR | 7.22% | 1.54% | 8.56% | -1.03% |
Source: Seeking Alpha, 13 Feb 24
IJH Holdings and Its Competitive Advantage
Due to the different objectives and tracked indexes of each of the compared mid-cap funds, their top holdings vary significantly. IJH, which is highly diversified with over 400 holdings, has only 7.1% weight on its top 10 holdings. By contrast, XMHQ with 81 holdings has 29.66% weight on its top 10 holdings.
Top 10 Holdings for IJH and Peer Mid-Cap ETFs
IJH – 405 holdings | VO – 333 holdings | SCHM – 499 holdings | XMHQ – 81 holdings |
SMCI – 1.34% | APH – 0.85% | PINS – 0.60% | SMCI – 6.11% |
DECK – 0.85% | ANET – 0.84% | VRT – 0.55% | MANH – 3.93% |
RS – 0.67% | TDG – 0.76% | PTC – 0.54% | DECK – 3.82% |
XTLSA – 0.66% | CTAS – 0.75% | DELL – 0.54% | WSM – 2.75% |
CSL – 0.66% | MSI – 0.75% | DECK – 0.54% | RS – 2.62% |
GDDY – 0.62% | PCAR – 0.73% | DKNG – 0.50% | CSL – 2.50% |
MANH – 0.60% | WELL – 0.72% | CBOE – 0.49% | WMS – 2.05% |
SAIA – 0.59% | MCHP – 0.70% | HUBB – 0.48% | WSO – 1.98% |
GGG – 0.58% | AJG – 0.70% | STLD – 0.48% | GGG – 1.96% |
LII – 0.57% | CARR – 0.69% | AXON – 0.48% | RNR – 1.94% |
Source: Multiple, compiled by author on 12 Feb 24
All ETF investors know that a fund’s future performance is tied to the returns of its individual holdings. Key holdings that represent distinct differences for the ETF are Deckers Outdoor Corporation (DECK), Super Micro Computer, Inc. (SMCI), and GoDaddy Inc. (GDDY). Each of these holdings represents advantages due to the qualities discussed in further detail below.
SMCI – High Performance Servers with Strong Growth and Momentum
The first difference representing an advantage for IJH is Super Micro Computers. This IT company develops high performance servers and storage products and has seen an astounding 750% one-year price return. While IJH’s top holding, SMCI unfortunately only carries 1.34% weight due to the fund’s broad diversification. Super Micro Computers has seen tremendous growth including a 39.2% YoY revenue growth and 64.5% YoY working capital growth thanks to its AI solutions and demand for servers. The primary drawback is SMCI’s high valuation. However, its forward P/E ratio is still only 34% higher than its sector median.
DECK: Footwear and Apparel Company with Growing Brand Recognition
The second difference propelling IJH is DECK. As a credit to this company’s performance, its share price has been up almost 100% over the past year. The company has seen 15.3% YoY revenue growth and a 39.9% YoY EBITDA growth. Beyond growth, it is also very profitable with a 54.4% gross profit margin and a 17.6% net income margin. With increasing brand recognition, the company is expecting an even stronger 2024 and is primed for solid growth looking forward. Additionally, its brands UGG and HOKA have seen YoY growth of 28.1% and 27.3%, respectively. Of note, while IJH has only a 0.85% weight on DECK, XMHQ (which has seen higher long-term performance) has a 3.82% weight on DECK.
GDDY: Cloud-Based Products and Free Cash Flow Growth
The final key ingredient supporting IJH is GoDaddy Inc. This cloud-based products company has seen a one-year price return of 38.5%. While IJH only has 0.62% weight, it is the only ETF examined that has the company as a holding. GoDaddy has seen strong growth with a forward EBITDA growth of 15.7%. GDDY is also very profitable with a 63% gross profit margin and 18.8% levered FCF margin. GoDaddy has made several important partnerships that prime the company for greater growth allowing enhanced solutions to small business customers, bank partners, and entrepreneurs. In addition to growth, the company restructured last year resulting in $100M in annualized cost savings.
Valuation and Risks to Investors
IJH has a current price of $276.64 at the time of writing this article. This price is near the top of its 52-week range of $231.49 to $280.70 and below its all-time high of $289.42 seen back in November 2021. Over the past year, IJH has underperformed most of its peer funds. Notably, XMHQ has performed far superior to the mid-cap funds examined predominantly due to its heavy weight on several of the key holdings discussed previously.
One-Year Price Return for IJH and Peer Mid-Cap Funds (Seeking Alpha)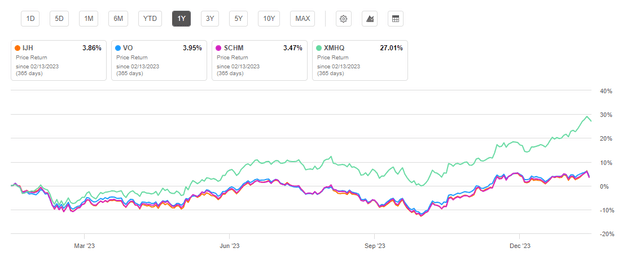
Although IJH has underperformed peer mid-cap ETFs, it presents a value opportunity for investors. Key metrics that indicate a favorable valuation for IJH are its P/E and P/B ratios. At 14.83, IJH has the lowest P/E of mid-cap funds compared. Additionally, its P/B ratio is also the most favorable at 2.36.
Valuation Metrics for IJH and Peer Competitors
IJH | VO | SCHM | XMHQ | |
P/E ratio | 14.83 | 20.5 | 17.04 | 16.14 |
P/B ratio | 2.36 | 3.0 | 2.47 | 3.58 |
Source: Compiled by Author from Multiple Sources, 12 Feb 24
Given IJH’s strong holdings mix and current valuation metrics, the fund is set for a strong year ahead. Additionally, lowering interest rates and additional “room to grow” compared to large caps make these mid-cap funds strong choices looking forward. Despite IJH’s favorable valuation and capacity for growth, the mid-cap funds examined in this article are not without risk. The volatility of the mid-cap funds examined can be determined looking at the beta value for each which is a measure of correlation compared to “the market” overall. A beta value greater than 1.0 implies increased volatility. IJH has a 5-year beta value of 1.13. By comparison, VO has a 5-year beta value of 1.09 compared to the Dow Jones U.S. Total Stock Market Index. XMHQ, which has outperformed IJH, has a beta value of 1.04.
Concluding Summary
The mid-cap ETFs discussed in this article grant investors exposure to holdings that are generally more volatile than large caps but have greater capacity for growth. IJH warrants a buy rating due to its ability to capture this mid-cap growth looking forward. This is demonstrated by its strong mix of holdings, low expense ratio, and broad diversification. SMCI, DECK, and GDDY are all examples of how IJH is well managed with solid potential for performance. Despite this potential, the fund is currently valued favorably with the lowest P/E and P/B ratios compared to peer mid-cap funds.


")


