AlexSava
While gold and silver prices have been in a clear uptrend in price since November, the related mining companies have moved in fits and starts. Good news is the largest miners in the world, part of the VanEck Gold Miners ETF (NYSEARCA:GDX), hold better-than-average value going into the next cycle jump in demand for gold assets.
I am maintaining my rating and view that buying the major gold mining enterprises will pay generous rewards as a recession hits, forcing the globe’s central bankers to again ease monetary policy and devalue paper currencies. And, as I have written in articles the last year and a half, gold prices under US$2000 an ounce are quite undervalued vs. the long-term rate of money supply growth and Treasury debt issuance in America. With a personal forecast of $2500 to $3000 an ounce gold later this year into early 2024, leveraging upside through miners is an excellent portfolio idea.
GDX Valuation
My first point of bullish logic is gold miners are actually trading below “average” valuations on underlying fundamental results vs. the last 20 years of history, including the past five. Assuming precious metal pricing climbs in the future (gold has risen +7.5% compounded annually since 1965, measured from just before we officially left gold convertibility for dollars), gold mining profits will continue to roll in the door at the longest-life reserve, lowest-cost and greatest ounce production majors.
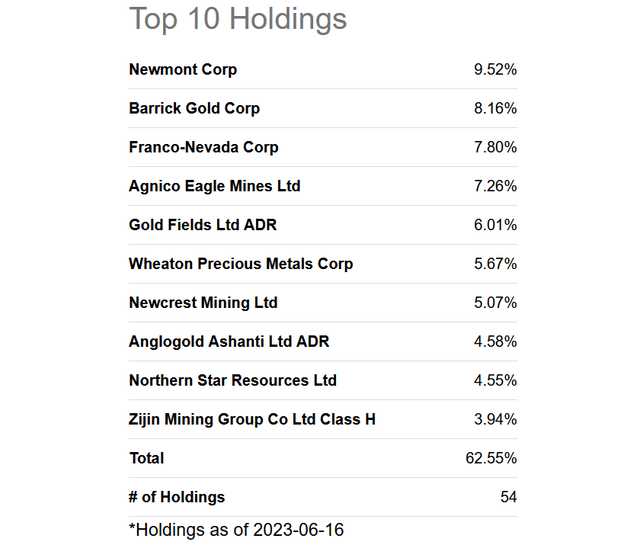
Seeking Alpha – GDX, Top 10 Holdings, June 16th, 2023
The Top 10 GDX holdings include Newmont (NEM), Barrick Gold (GOLD), Franco-Nevada (FNV), Agnico Eagle (AEM), Gold Fields (GFI), Wheaton Precious Metals (WPM), Newcrest Mining (OTCPK:NCMGF), AngloGold Ashanti (AU), Northern Star Resources (OTCPK:NESRF), and Zijin Mining (OTCPK:ZIJMF). This group represented around 63% of the trust’s worth at the close on Friday. (Note: several of the names are royalty lenders.)
On total enterprise value, where we take stock market capitalization, add all debt to this sum, then subtract out cash holdings, we can review a theoretical net-zero debt buyout number for each mining business.
EV compared to basic cash EBITDA is drawn below for the Top 10 positions in the GDX ETF. You can see overall group valuations on EBITDA are not much higher than at the 2018 bottom in gold miners, and well underneath the highs of 2020.
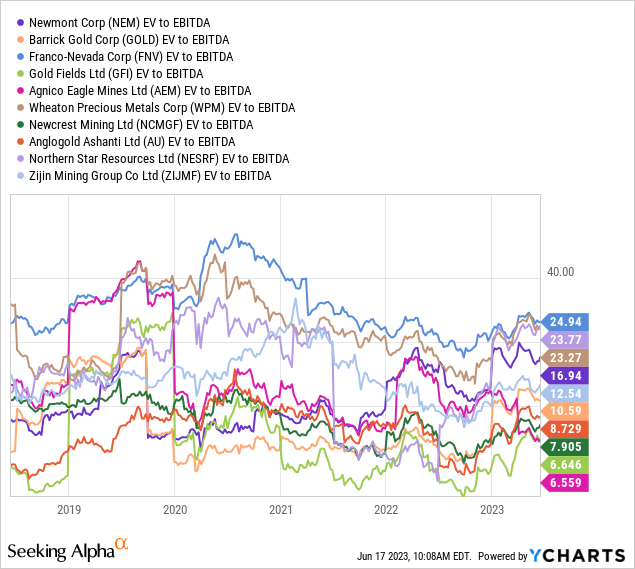
YCharts – GDX, Top 10 Holdings, EV to EBITDA, 5 Years
Again, on EV to sales, most names are trading closer to 5-year lows than highs. So, if a bull market move in gold/silver bullion prices appears soon, the upside in gold miners is likely quite substantial.
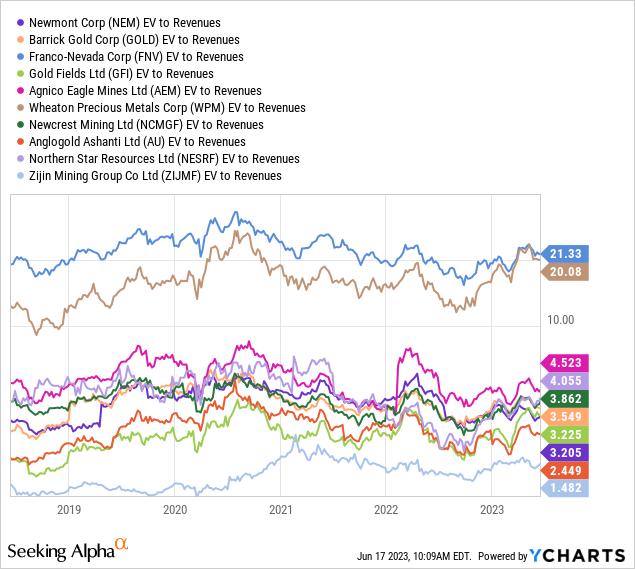
YCharts – GDX, Top 10 Holdings, EV to Revenues, 5 Years
Lastly, gold miners have typically paid a dividend yield HALF of the prevailing rate of the S&P 500 over the past 50 years. Today, a trailing 1.5% GDX dividend payout on today’s ETF price is the same rate as the S&P 500. This means you are getting hard-money gold in the ground in exchange for your investment dollars, production and sales at a nice profit each year, plus a cash distribution the same as many other equity alternatives on Wall Street.
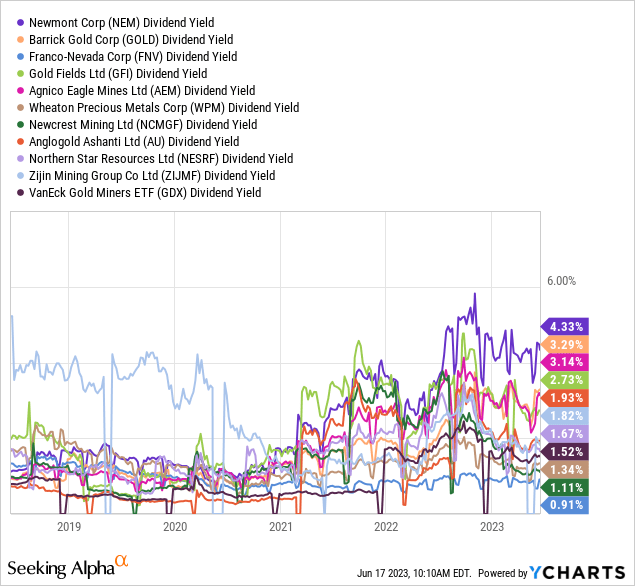
YCharts – GDX, Top 10 Holdings, Dividend Yields, 5 Years
Taken together, the gold mining valuation backdrop is not extremely overvalued or over-owned like Big Tech names right now. If you want a hedge position for your portfolio, where returns often run counter to regular Wall Street direction, GDX should absolutely be considered.
Gold Asset Money Flows Reversing To Upside
Why gold now? Gold in U.S. dollars has been trading in a high base pattern since its August 2020 all-time high of nearly $2100 an ounce. Some technicians are arguing it has been creating a super-bullish, cup-and-handle formation since 2012, with a breakout above $2100 having the potential to push quotes markedly higher. No matter how you look at it, a breakout to new all-time highs just 7% away from the current quote of $1971 could lead to an avalanche of buying interest.
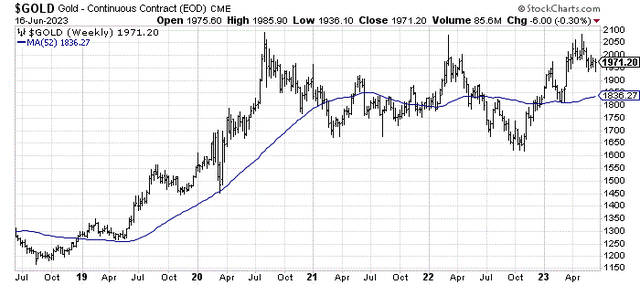
StockCharts.com – Nearby Gold Futures, Weekly Prices, 5 Years
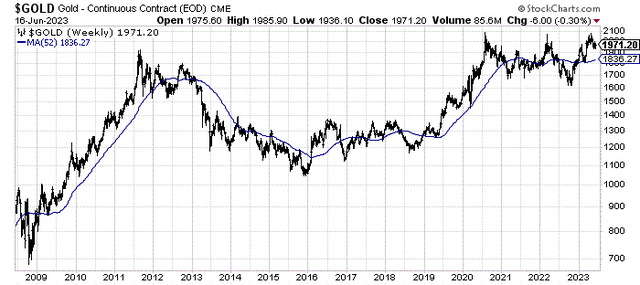
StockCharts.com – Nearby Gold Futures, Weekly Prices, 15 Years
Specifically for June 2023, the drawdown in price from early May could be bottoming. Below I have drawn a 2-year chart of daily trading. A low 28-day Average Directional Index score under 12 (boxed in gold), coinciding with a solid improvement in the 20-day Chaikin Money Flow indicator after a steeply oversold reading, last took place in early January 2022 (green arrow). The intermediate-term ADX calculation pinpoints a low-volatility balance in supply/demand. Then, when money flows improve out of such a balance, bullish price gains usually follow.
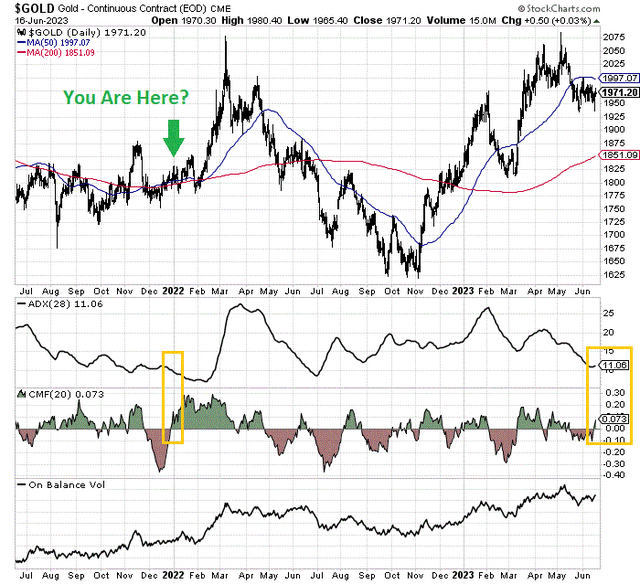
StockCharts.com – Nearby Gold Futures, 2 Years of Daily Price Changes, Author Reference Points
A similar setup is also taking place in silver. I have circled past price bottoms in green, where 28-day ADX readings under 13 are prevalent and positive CMF starts to appear or is already in place. Another bullish data point for both gold and silver futures trading is On Balance Volume signals have been quite bullish for years, with both reaching new highs in May (possibly leading price gains soon).
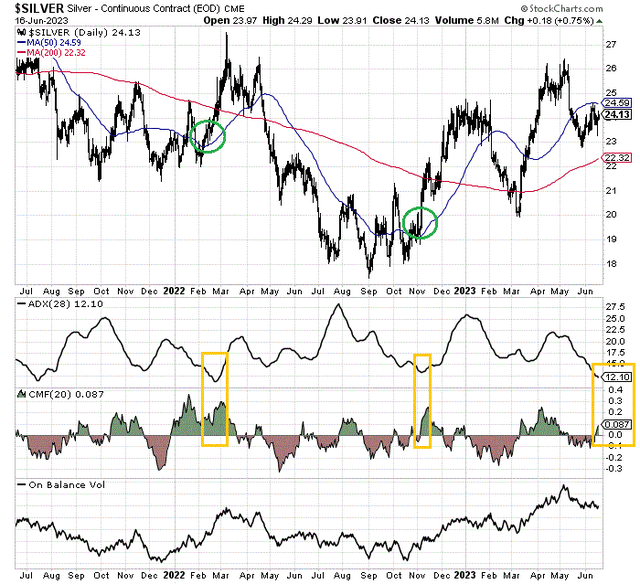
StockCharts.com – Nearby Silver Futures, 2 Years of Daily Price Changes, Author Reference Points
For GDX trading, On Balance Volume and Accumulation/Distribution Line trends have been constructive. I would highlight the low 28-day ADX scores under 12 over the last couple of days. This low-volatility balance in trading is quite similar to January-February 2022 (circled in green). So, any renewed buying interest in gold miners should generate a meaningful price gain from here.
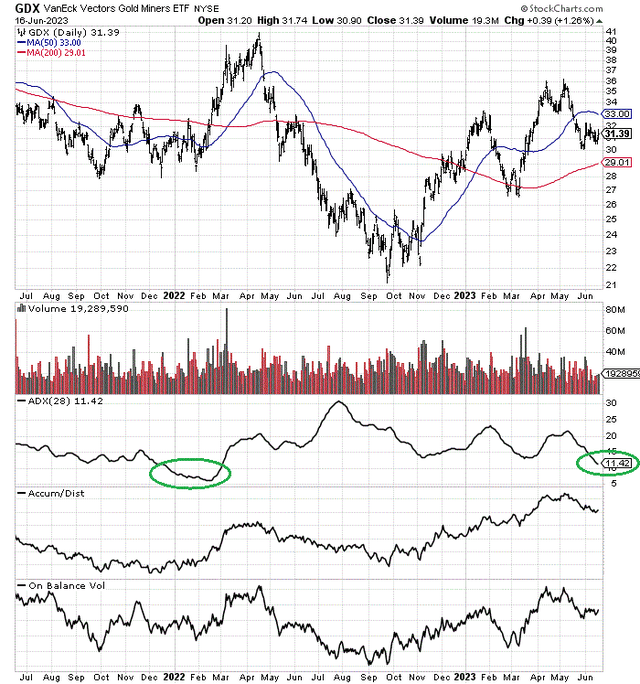
StockCharts.com – GDX, 2 Years of Daily Price & Volume Changes, Author Reference Points
Final Thoughts
I know that owning gold/silver assets since the summer of 2020 has not been a fun or productive endeavor. But things change, especially on Wall Street. If you are patient, parking capital in gold/silver bullion plus the major miners should be rewarded handsomely, as a Fed pivot to money printing is inevitable to keep our record debt bubble from imploding.
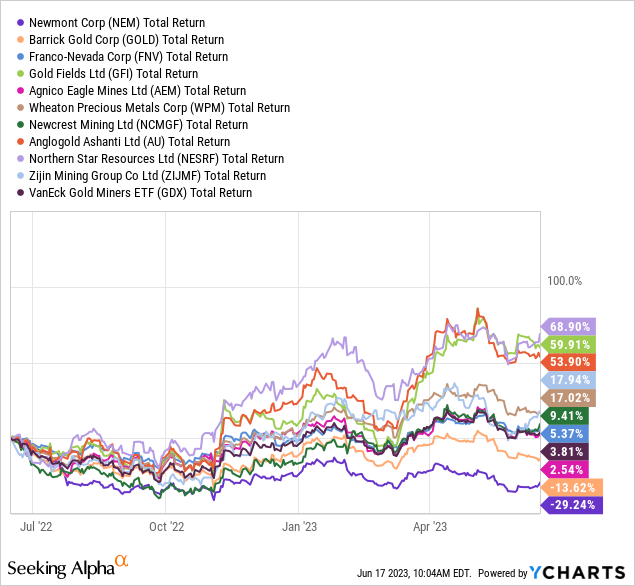
YCharts – GDX, Top 10 Holdings, Total Returns, 1 Year
You cannot have record aggregate debts in the U.S. economy vs. GDP (outside of the pandemic economic shutdown), not far from 270% of annual economic output for nonfinancial sector debt, and expect monetary tightening by the FED forever.
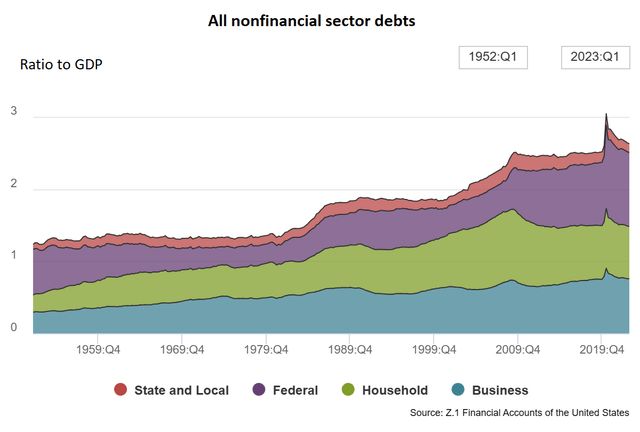
U.S. Federal Reserve – Z.1 Financial Accounts Data, June 2023
Eventually something will break. For example, the stock market may swoon or a deep recession could erupt at any moment after 18 months of tightening policy. We may get a black swan geopolitical event that causes extra demand for precious metals. Record central bank buying of gold over the last year has created the largest inversion in futures trading premiums (implied lease rates) in favor of nearby deliveries, I have seen in 36 years of trading. Without doubt, something of a physical shortage of bullion is developing in both gold and silver. You can also find evidence of this situation in the modern record premiums of 2022-23 for gold/silver coins.
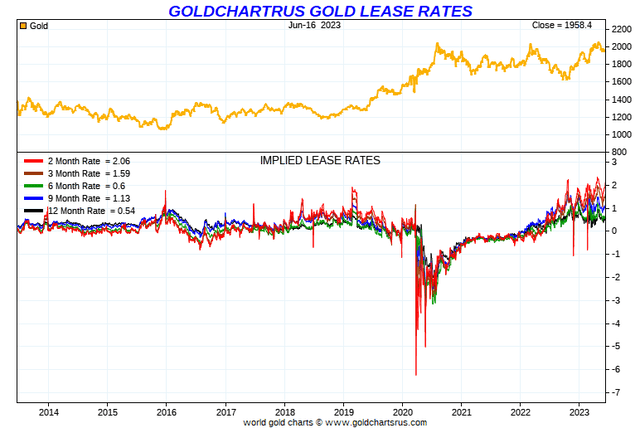
GoldChartsRUS.com – Gold Implied Lease Rates, 10 Years
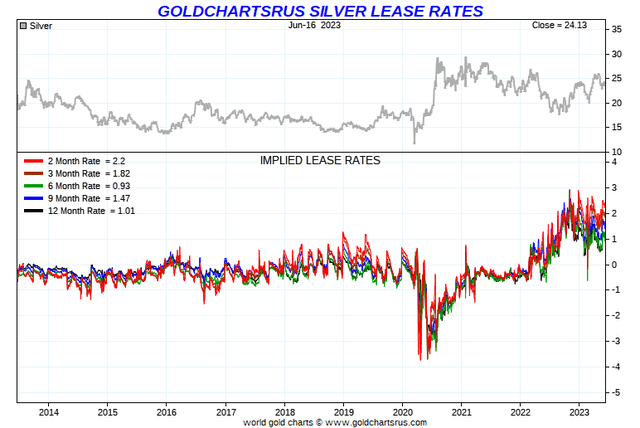
GoldChartsRUS.com – Silver Implied Lease Rates, 10 Years
I trade precious metals assets almost daily and have an oversized position in gold/silver bullion today. I rate the current gold/silver ownership environment as an 8 out of 10 setup (where 0 is completely bearish and 10 completely bullish). Sharp gains could appear quickly, with little warning. And, when the Fed is finally able to ease policy again (fiat money printing escalates), the background rating situation for gold/silver will climb into a 9 out of 10, or 10 out of 10 setup for investors.
If we find gold at $2500 or higher by December (as a recession and lower dollar exchange value appear as my forecast), looking back you may wish you had purchased a decent amount of gold/silver in June. I rate GDX a Buy, as a way to add diversified and immediate exposure to gold miners. I fully expect the major gold miners to double the percentage rise in gold/silver bullion over the next 6-12 months, which is the usual outcome in past cycle upswings.
Of course, the largest and clearest risk to this bullish outlook is continued Fed tightening, with a reciprocal rise in the U.S. dollar’s worth. Again, with a physical shortage at your local coin dealer, and uncommon lease rate spread inversions, the odds heavily favor rising gold/silver asset prices. I will take sides with the math in my portfolio.
Thanks for reading. Please consider this article a first step in your due diligence process. Consulting with a registered and experienced investment advisor is recommended before making any trade.
Editor’s Note: This article discusses one or more securities that do not trade on a major U.S. exchange. Please be aware of the risks associated with these stocks.


