

Ingenious Buddy/iStock via Getty Images
Executive Summary
Fixed income funds realized a return of negative 1.70% on average during the third quarter of 2023, marking the first negative quarterly return since Q3 of last year. Taxable bond funds (-1.14%) outperformed tax-exempt bond funds (-3.31%) in quarterly performance for the third consecutive quarter—the last time taxable outperformed taxexempt in three straight quarters was Q2 through Q4 2020. Tax-exempt bond funds are on pace to log their first back-to-back calendar year with negative returns since 1980 and 1981. After three straight quarters of gains in fixed income and equity fund markets, both have realized their first quarterly decline. There was a strong feeling from market participants heading into Q3 that we might be headed for a soft landing. That feeling poured over into July but did not last. In July, the Bureau of Economic Analysis (BEA) reported Q2 2023 real gross domestic product (GPD) increased at an annual rate of 2.4%—later revised down to 2.1% annual growth, but still above original expectations. The agency also reported that both June’s personal consumption expenditure (PCE) index (+3.2%) and core-PCE index (4.3%) rose year over year, remaining far above the Federal Reserve’s target of 2%. Despite the high PCE readings, consumer confidence increased to its best reading since October 2021, according to the University of Michigan Consumer Sentiment Index. The month concluded with the July Federal Open Market Committee (OTCPK:FOMC) meeting where the Fed decided to increase interest rates by another 25 basis points (bps) as they continue to walk the tightrope of curbing inflation without causing a significant recession. Fed Chair Jerome Powell said on the committee’s decision, “The staff now has a noticeable slowdown in growth starting later this year in the forecast, but given the resilience of the economy recently, they are no longer forecasting a recession.” The Lipper General Bond Fund Index (+0.57%) and Lipper High Yield Bond Index (+1.44%) recorded strong July returns.
August kicked off with ratings agency Fitch downgrading the United States long-term rating from AAA to AA+, mirroring what S&P Global Ratings did in 2011. Fitch first placed the U.S. sovereign status on watch negative in May due to political dysfunction in Washington over the debt crisis. Fitch stated, “The repeated debt-limit political standoffs and last-minute resolution have eroded confidence in fiscal management…the government lacks mediumterm fiscal framework, unlike most peers, and has a complex budgeting process.” July retail sales beat expectations as they increased 0.7% from June and 3.2% year over year. PCE and core-PCE (the Fed’s preferred measure of inflation) remained higher, as reported in August— year-over-year core-PCE increased at a rate of 4.3%. Job growth continues to decelerate with non-farm payrolls gaining 187,000 and 157,000 jobs in August and July, respectively—far below the monthly gain average of 271,000 over the past year. Consumer confidence also fell during August. The Lipper General Bond Fund Index (-0.35%) fell over the month, while the Lipper High Yield Bond Index (+0.29%) reported a monthly gain.
After 11 interest rate hikes in 16 months, the Fed decided to keep rates steady during is September meeting. This was the second time this year where the central bank left rates unchanged. Fed Chair Jerome Powell said, “In terms of inflation, you are seeing the last three readings are very good readings…If the economy comes in stronger than expected LSEG Lipper that just means we’ll have to do more in terms of monetary policy to get back to 2%, because we will get back to 2%.” Enter the market’s new phrase, “higher for longer”. Year-over-year PCE accelerated from prior month to an annual gain of 3.5%, while year-over-year corePCE remained steady at 4.3%. At the time of writing this, the market is currently forecasting the Fed to leave rates unchanged once again. Market dynamics may be shifting to where interest rate decisions might be less determined by Fed inflation expectations and more by US budget deficits, higher global rates, and a shrinking demand for US treasuries abroad. Fixed income funds struggled in September—the Lipper General Bond Fund Index (-2.16%) and Lipper High Yield Bond Index (-1.11%) both realized losses.
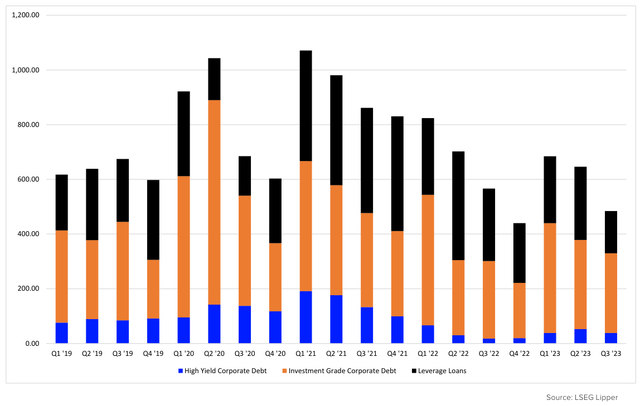
Figure 1: Debt Issuance: Proceeds Amount + Over Sold This Market ($bil)
Of the 51 Lipper fixed income classifications, only 11 ended the second quarter with gains—down from 23 last quarter. Eight fixed income classifications outperformed their Q2 return—four fixed income classifications outperformed quarter over quarter in Q2 2023.
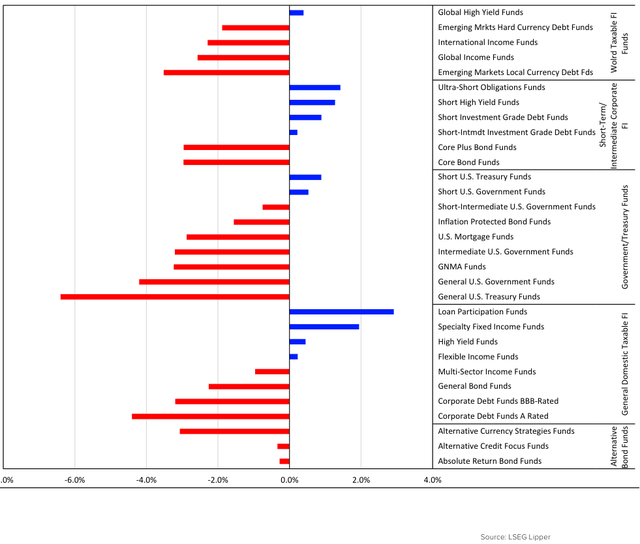
The top-performing Lipper classifications throughout Q3 were Loan Participation Funds (+2.91%), Specialty Fixed Income Funds (+1.94%), Ultra-Short Obligations Funds (+1.42%), Short High Yield Funds (+1.27%), and Short Investment Grade Debt Funds (+1.27%).
While Lipper Loan Participation Funds was the top returning fixed income classification over the quarter, newly issued leverage loan debt fell to its lowest level since Q2 2020, in terms of overall volume. In terms of total number of issues, leverage loan issuance hit its lowest mark since Q3 2010.
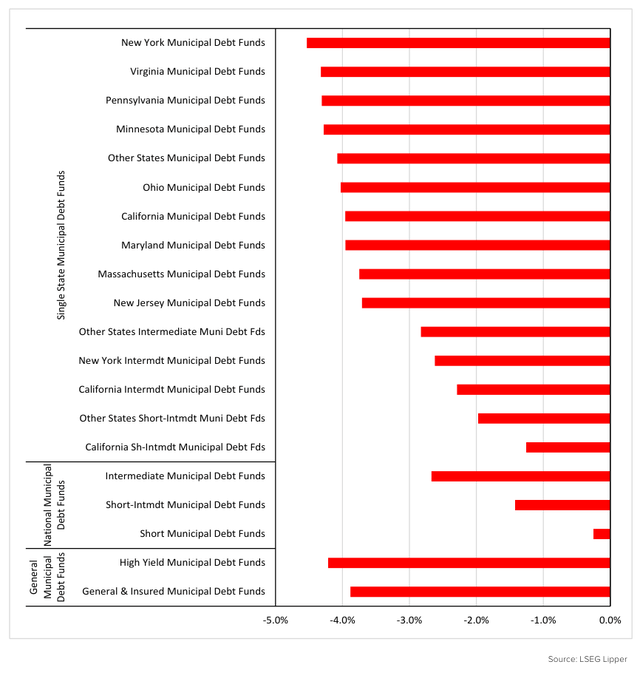
General U.S. Treasury Funds (-6.40%), New York Municipal Debt Funds (-4.53%), Corporate Debt A-Rated Funds (-4.40%), Virginia Municipal Debt Funds (-4.32%), and Pennsylvania Municipal Debt Funds (-4.31%) closed the quarter as the worst-performing classifications.
Lipper’s 51 fixed income classifications each fall under one of the eight fixed income macro-groups. All eight reported Q3 losses—General Municipal Debt Funds (-4.01%), Single State Municipal Debt Funds (-3.77%), and Government/Treasury Funds (-2.49%) were the bottom three. The three-top macro groups during the quarter were General Domestic Taxable Fixed Income Funds (-0.25%), Alternative Bond Funds (-0.72%), and Short-Term/ Intermediate Corporate Fixed Income Funds (-1.12%). All eight macro-groups underperformed their Q2 returns. The last time each macro-group realized negative returns was Q3 of last year.
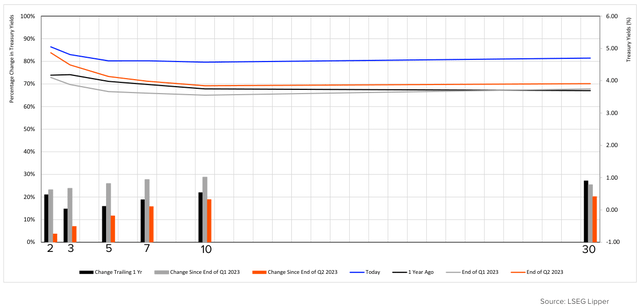
Figure 2: TREASURY YIELD CURVE: MOVEMENT OVER THE PAST YEAR
Government/Treasury Funds Summary
The Treasury yield curve steepened slightly quarter over the quarter, but the 10-two Treasury yield remains inverted. Since the end of the second quarter of 2023, the two- and three-year Treasury yields have risen 3.78% and 7.11%, respectively, while the 10- and 30-year yields have jumped 18.96% and 20.24%.
The Government/Treasury funds macro-group posted a negative 2.49% return on average over the quarter, marking the second quarter in three in the red and the fifth in the last seven. Q3 2023 was this macro-group’s worst-performing quarter since Q3 2022.
The three top Lipper classifications under Government/Treasury funds were Short U.S. Treasury Funds (+0.89%), Short U.S. Government Funds (+0.53%), and Short-Intermediate U.S. Government Funds (-0.75%). The Short U.S. Treasury Funds classifications are made up of funds that primarily invest in U.S. Treasury bills, notes, and bonds with a dollar-weighted average maturity of less than three years. This classification was the top performer for the second straight quarter while being only one of eight classifications to realize four straight quarterly gains. The last time this classification reported four straight quarterly gains was Q4 2019 through Q3 2020.
The worst-performing classifications under this macro-group were General U.S. Treasury Funds (-6.40%), General U.S. Government Funds (-4.20%), and GNMA Funds (-3.23%). General U.S. Treasury and General U.S. Government funds were the bottom two performing classifications last quarter as well. General U.S. Treasury Funds have posted six negative performing quarters in the last seven.
World Fixed Income Funds Summary
World fixed income funds also realized poor returns in Q3 2023; their loss of 2.02% was the first in the past four quarters and seventh over the last 11. All five of the Lipper classification in this macro-group underperformed the previous quarter’s returns.
The only classification to end the quarter on the plus side was Global High Yield Funds (+0.39%), marking the fourth straight quarterly gain giving them 10 over the past 14 in plus side territory.
Emerging Markets Local Currency Debt Funds (-3.52%), Global Income Funds (-2.57%), and International Income Funds (-2.29%) finished at the bottom of this macro-group. Emerging Markets Local Currency Debt Funds have suffered their first sub-zero return in four quarters, while Global Income and International Income Funds have reported two straight quarters with losses.
Figure 3: Q3 2023 Taxable Fixed Income Performance (%)
Short-Term Intermediate Corporate Bond Funds Summary
Short-term intermediate corporate bond funds finished the second quarter with negative quarterly performance (-1.12%), their second loss in the last three quarters and six in the last eight. Four of the six classifications under this macro-group realized gains in the quarter.
The top-performing Lipper classification in this macro-group was Ultra-Short Obligation Funds (+1.42%), followed by Short High Yield Funds (+1.27%) and Short Investment Grade Debt Funds (+0.09%). Both Short High Yield Funds and Ultra-Short Obligation Funds have strung together five straight quarters of positive performance, while Short High Yield Funds have realized 16 quarterly gains over the last 19. This is the second straight quarter where these three Lipper classifications came in on top of the macro group.
At the bottom of this macro-group during Q2 were Core Bond Funds (-2.96%), Core Plus Bond Funds (-2.96%), and Short-Intermediate Investment Grade Debt Funds (+0.22%). Short-Intermediate Investment Grade Debt Funds actually logged their third positive quarterly return in the past four, while Core Bond Funds and Core Plus Bond Funds have suffered at least six quarterly losses over the past nine.
General Domestic Taxable Bond Funds Summary
As a macro-group, general domestic taxable fixed income funds finished the quarter returning a negative 0.25%, their first quarter in the red over the last four.
Lipper Loan Participation Funds (+2.91%), Specialty Fixed Income Funds (+1.94%), and High Yield Funds (+0.45%) were the leading classifications under General Domestic Taxable Bond Funds. Loan Participation Funds continued their steady dominance with the fifth straight quarter of positive returns—one of three fixed income classifications to reach that feat. This classification has posted gains in 27 of the last 31 quarters, dating back to Q2 2016. While most of their holdings are bank loans, according to LSEG Lipper data, Loan Participation Funds, on average, held roughly 6% in corporate debt securities with another 27% in mortgage-back securities as of quarter end. Loan Participation Funds also have the lowest average collected effective duration as of September 30 (0.34).
Corporate Debt A-Rated Funds (-4.40%), Corporate Debt BBB-Rated Funds (-3.19%), and General Bond Funds (-2.26%) were the lowestperforming classifications of the macro-group. These three classifications all have average effective durations of more than 6.4, with Corporate Debt A-Rated Funds holding the second highest of all fixed income (8.73). Despite all three classifications lowering their duration quarter over quarter, this was the second straight quarter during which these three represented the bottom performers of General Domestic Taxable Bond Funds. All three have suffered five negative quarterly returns in the last seven.
Municipal Debt Funds Summary
Municipal debt funds recorded an average loss of 3.31% in the third quarter of 2023—marking their first negative return in four quarters. All 20 municipal classifications realized sub-zero returns during the quarter—the first time since Q3 2023.
The macro groups under municipal debt funds all had negative quarterly returns—General Municipal Debt Funds (-4.01%), National Municipal Debt Funds (-1.67%), and Single State Municipal Debt Funds (-3.77%). For National and Single-State Municipal Debt funds, this was the second straight quarter of losses and the fifth over the last seven. General Municipal Debt Funds logged its first negative quarterly return in four.
The two top-performing non-single state tax-exempt Lipper classifications were Short Municipal Debt Funds (-0.25%) and Short-Intermediate Municipal Debt Funds (-1.42%)—Short Municipal Debt Funds was one of eight municipal bond classifications to observe plus-side returns during the previous quarter.
The three top-performing classifications under Single State Municipal Debt Funds were California Short-Intermediate Municipal Debt Funds (-1.25%), Other States Short-Intermediate Muni Debt Funds (-1.97%), and California Intermediate Municipal Debt Funds (-2.29%). Each of these three classifications have observed two straight quarterly losses.
The three worst-performing classifications under Single State Municipal Debt Funds were New York Municipal Debt Funds (-4.53%), Virginia Municipal Debt Funds (-4.32%), and Pennsylvania Municipal Debt Funds (-4.31%). Both New York and Pennsylvania Municipal Debt Funds posted their first loss in four quarters.
Figure 4: Q3 2023 Tax-Exempt Fixed Income Performance (%)
Click Here To Download the Third Quarter 2023 fund Market Insight Report: Fixed Income Funds Realize First Quarterly Loss of 2023—loan Participation Funds Remain Resilient
© LSEG Lipper 2023. All Rights Reserved. Lipper FundMarket Insight Reports are for informational purposes only, and do not constitute investment advice or an offer to sell or the solicitation of an offer to buy any security of any entity in any jurisdiction. No guarantee is made that the information in this report is accurate or complete and no warranties are made with regard to the results to be obtained from its use. In addition, Lipper will not be Lliable for any loss or damage resulting from information obtained from Refinitiv Lipper or any of its affiliates.
For immediate assistance, feel free to contact Lipper Client Services toll-free at 877.955.4773 or via email at [email protected]. For more information about Lipper, please visit our website at Financial Technology, Data, and Expertise or Lipper Alpha Insight | Refinitiv


")


