Zolnierek
Investment Thesis
Evolution AB (OTCPK:EVVTY) (“EVO”) is the leading B2B supplier of Live Casino (“LC”) games in Europe, Latin America, the U.S., Asia, and Spain. It is riding on a secular tailwind with an increasing number of newly regulated markets, and the transition from land-based to online casinos.
EVO’s main competitive advantages lie in its operational excellence, product innovation, and customer centricity to improve players’ experiences. These are hard to replicate, which forms a strong barrier to entry.
From FY20 to FY22, it went on an M&A spree to acquire NetEnt, Big Time Gaming, and No Limit City, which transformed EVO into a leading slot gaming provider. This segment, also known as the RNG, is not performing, and the success of these M&A remains to be seen.
In this article, I will be covering EVO’s 4Q22 and its full-year results which were released last week. If you have not already known, I had published parts 1 and 2 of my deep dive into the company.
Revenue
1) Live Casino & RNG
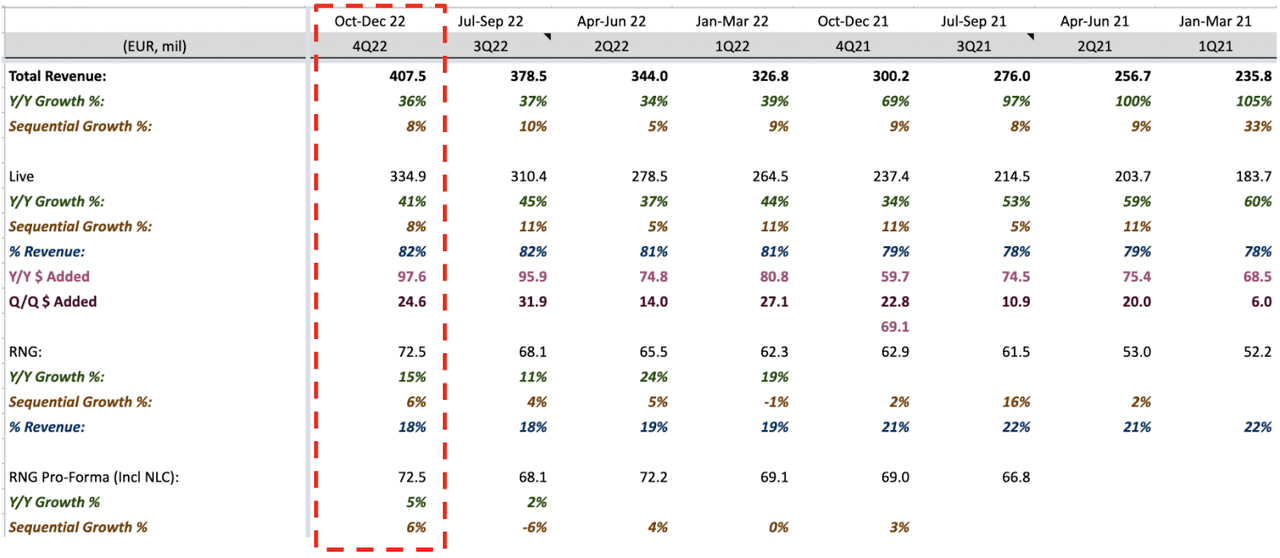
LC Revenue Extracted From EVO’s Financial Reports
Live Casino (“LC”) 4Q22 revenue grew 41% Y/Y and 8% Q/Q to ~$335 million, bringing its full-year FY22 revenue to ~$1.2 billion. This is a record high of $349 million in revenue added from FY21, compared to $293 million in revenue added from FY20 to FY21.
This overall strong performance is attributed to its (1) strong new product releases, (2) continued growing worldwide demand from users, (3) expansion into newly regulated markets, and (4) increasing market share in existing markets.
Its RNG segment consists of revenues from NetEnt, Big Time Gaming (“BTG”), and Nolimit City (“NLC”).
Expectedly, the results were underwhelming. Including NLC’s revenue in 4Q21, this quarter’s pro-forma annual growth is only a mere 5%, compared to 2% in 4Q21. This brings its FY22 revenue to ~$268 million, making up 18% of its total revenue.
I have previously talked about the reasons for the slower growth, but for the benefit of new readers, it was impacted by the slowdown in game releases, mainly for NetEnt. Both NLC and BTG should constitute roughly ~30% of revenue, and the rest by NetEnt. This is an intentional move by the management to prioritize game quality over the number of games being released, which is dragging down its revenue.
However, this strategy of focusing on quality over quantity could be reversed based on the management’s commentary in this quarter’s earnings call, and I will touch on this later.
2) Revenue by Regions
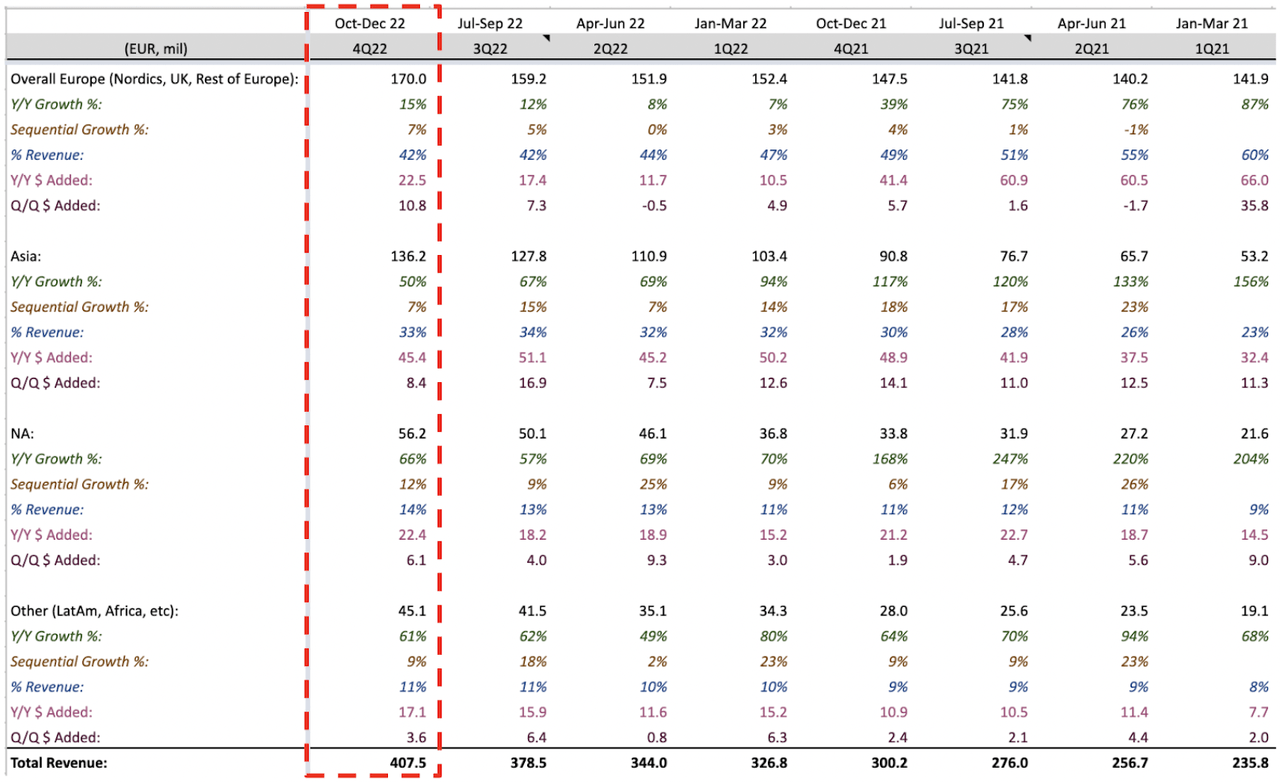
Quarterly Revenue by Regions Extracted From EVO’s FY22 Year-End Report
There are a few events to note:
-
BTG’s financials is included since 3Q21
-
NetEnt financials is included since 4Q20. The big jump in FY21’s North America (“NA”) revenue is driven by NetEnt’s full-year revenue contribution
-
NLC’s financials is included since 3Q22
-
These are non-pro-forma figures, so certain quarters are driven by revenue from acquisitions
EVO’s revenue is largely driven by Asia, North America (“N.A.”) and others (mainly LatAm), with 50%, 66%, and 61% Y/Y growth, respectively. These markets are making up a larger proportion of the revenue, with Asia at 33%, N.A. at 14%, and other revenue at 11%.
Despite Asia generating over $100 million in revenue, it’s 50% Y/Y growth is impressive. N.A. grew the fastest at 66% Y/Y, driven by growing demand for its LC products, and increased legislation. During the quarter, they launched their 3rd U.S. studio and new crap games in New Jersey. Other countries, primarily driven by LatAm, are growing at 61% Y/Y, also driven by the introduction of legislation.
In contrast, Europe is making up a smaller chunk of revenue, but because this is a relatively mature region for EVO and the impact of re-regulations is slowing down its growth. This is still a pretty strong result as they grew 7% Q/Q, adding about $10.8 million of revenue from 3Q22, one of its strongest quarters.
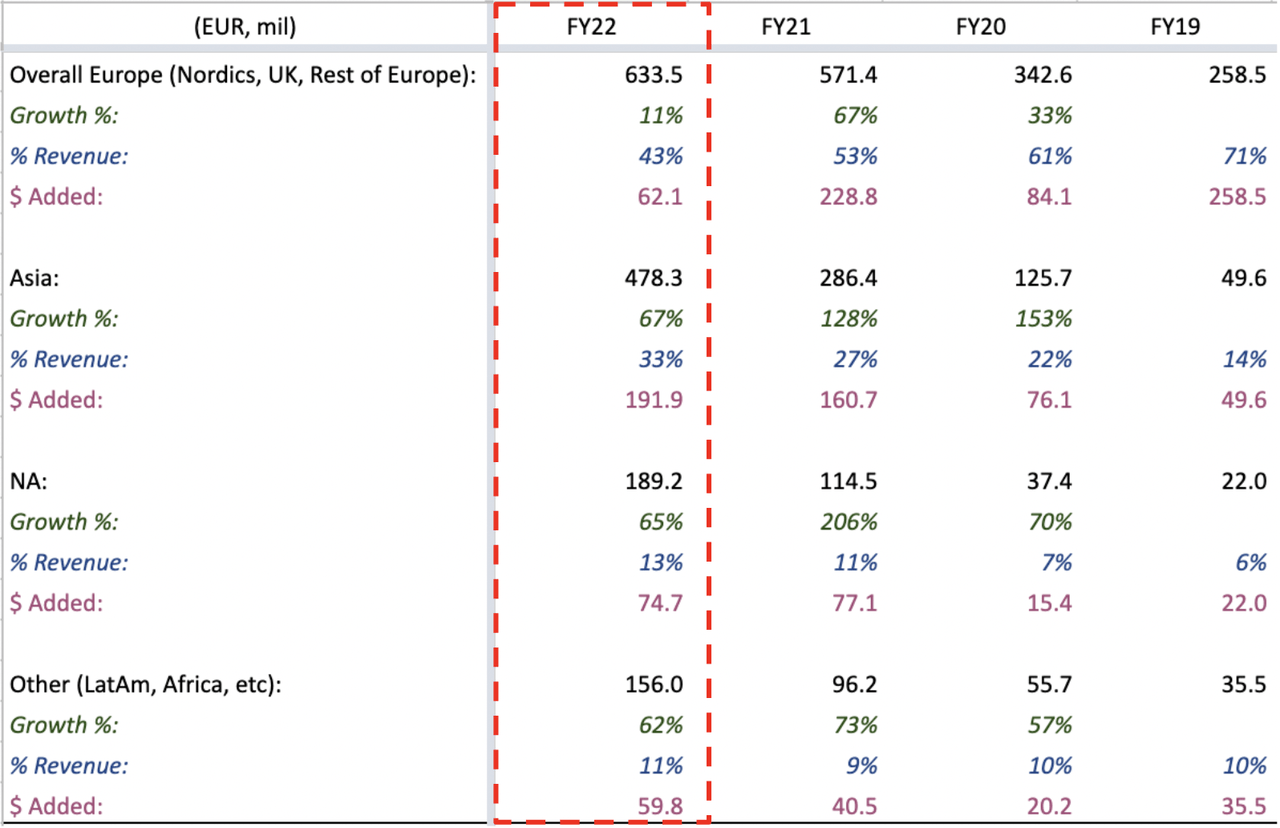
Full-Year Revenue by Regions Extracted From EVO’s Financial Reports
On a full-year basis, Europe, Asia, N.A., and other countries grew 11%, 67%, 65%, and 62%, respectively, and on a percentage basis, they make up 43%, 33%, 13%, and 11%, of the overall revenue, respectively.
Asia was easily the best-performing region and growth driver for EVO in FY22, adding a record high of ~$192 million of revenue, followed by N.A. of $74.7m of revenue added, and other countries (largely LatAm) adding a record high of ~$60 million of revenue from FY21.
FY23 Outlook
This year will be their strongest product year as they will be launching 100 new games versus 88 in 2022, a ramp-up in game releases.
This is a crucial year for the RNG segment as they seek to accelerate its growth by doubling the number of NetEnt’s product releases, the addition of new bonus tools, and distributing its game through a wider network of operators through One-Stop-Shop (“OSS”).
Particularly, on the RNG product releases front, CEO Martin Carlesund states that:
“…the roadmap for RNG looks much better 2023 than it did 2022. To single something out we will double the amount of releases on that front (not sure if they are referring to NetEnt?), which is highly needed and we see great potential in that. When it comes to quality that’s a hard one. It’s a little bit more of a volume business when it comes to RNG.” – CEO Martin Carlesund in 4Q22 Earnings Call (with emphasis added)
The last sentence seems to imply that the strategy of focusing solely on quality is not working out, and that quantities matter more, at least in the case of NetEnt. It is still unsure whether management has already figured out the playbook to operate slots successfully.
And to meet the growing worldwide demand for LC games, they will expand existing studios and build out new studios in regions like the U.S., LatAm, and Spain. As more regulations get introduced, this extends the addressable market for EVO to expand into.
Profitability
1) OpEx and EBITDA
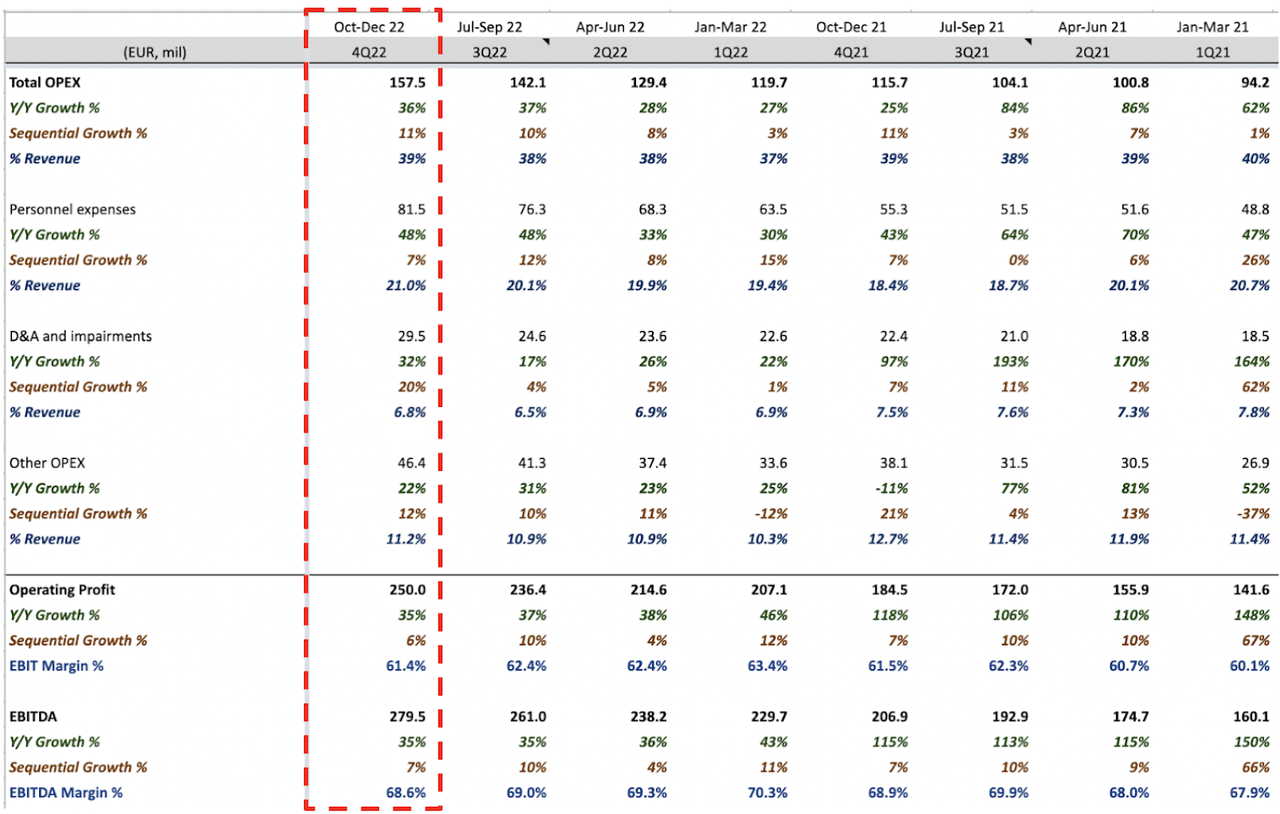
OpEx & EBITDA Margins Extracted From EVO’s Financial Reports
This quarter’s total OpEx grew 36% Y/Y to $158 million, largely driven by the 48% Y/Y growth in personal expenses to ~$82 million, making up 21% of revenue, and then 32% growth in D&A and impairments to ~$30 million, and 22% growth in other OpEx to ~$46 million. These expenses will increase along with the growth in CapEx as they built out more studios and expand existing studios, increase headcounts, and production of new games.
EBITDA came in at ~$280 million and the EBITDA margin is 68.6%, a decline from previous quarters. Its overall FY22 EBITDA margin of 69.2% is in line with the management’s expectations. As they are prepared to ramp up the number of new studios, a trade-off is expected to occur between growth and margins. Management guided for a 68% to 71% EBITDA margin in FY23, due to the potential cost pressures.
2) Rising Tax Rates and Lower Net Margins

Tax Rates & Net Margins Extracted From EVO’s Financial Reports
This quarter, the financial items which relate to leasing interest expenses and FX currency exchange differences of $9.5 million, are significantly higher than in previous quarters. Tax rates also rose the quarter as they expand into new markets, and this will steadily rise over time with the 15% minimum tax rates set to be implemented in FY24.
Its net margins, as a result of increased investments, record-high financial items, and rising tax rates, are 54.8%, lower than in previous quarters.
These are still remarkable results as EVO managed to maintain its industry-leading margin from FY20 and FY21 when they experienced strong operating leverage due to increased traffic volumes and fewer available tables (impacted by Covid restrictions).
3) Growing Earnings Per Share

EPS Extracted From EVO’s Financial Reports
One of the most important metrics to track shareholders’ return, its earnings per share (“EPS”), grew 42% Y/Y to $3.88 in FY22.
Increased Capital Expenditures

CapEx Extracted From EVO Financial Reports
As growth continues to be prioritized over margins, expected investments in CapEx, including tangible (i.e. studio) and intangible assets (i.e. producing new games), will rise to $120 million in FY23 as guided by the management.
FCF, FCF Margin & FCF per Share

Free Cash Flow Extracted From EVO Financial Reports
FY22 FCF grew 14% Y/Y to ~$507 million, translating to 35% FCF margin versus 42% in FY21. This is due to the non-recurring costs related to the acquisitions, and I do suspect some M&A costs will be carried into FY23, although, the amount will be lesser than in FY22.
Despite these heavy acquisitions’ related costs, FCF has continued to grow, and FCF per share also grew 16% Y/Y, creating more shareholders’ value on a per-share basis.
Conclusion
Overall, this was an outstanding year for LC, but not for the RNG segment.
The concerns lie in that the management has yet to crack the code on how to run a slot game successfully. Could the strategy laid out by the management be successful? Time will only tell if these are value-accretive or value-disruptive M&As. LC, on the other hand, is garnering worldwide popularity, and they are rapidly expanding by building out new studios in newly regulated markets.
What are your thoughts on the quarter? Let me know in the comment section below.
Editor’s Note: This article discusses one or more securities that do not trade on a major U.S. exchange. Please be aware of the risks associated with these stocks.


