

Khanchit Khirisutchalual
Introduction:
Eaton Vance Tax-Advantaged Global Dividend Income Fund (NYSE:ETG) is a closed-end fund, or CEF, that was incepted in January 2004. The fund’s primary objective is to provide a high level of after-tax income. Along with total return, it also provides a reasonably high income (6.80% at current prices), even though it is a bit lower than many other CEFs. As the name indicates, the fund tries to make the distributions in an efficient tax manner as much as possible. To make distributions tax efficient, it provides some of the distribution as ROC (return of capital). So, in that sense, it may be better to buy this fund in a taxable account.
As per the fund’s literature:
“The Fund’s investment objective is to provide a high level of after-tax total return. Such return is expected to consist primarily of tax-advantaged dividend income and capital appreciation. Under normal market conditions, the Fund invests at least 80% of its total managed assets in dividend-paying common and preferred stocks of U.S. and foreign issuers that the Fund’s investment adviser believes at the time of investment are eligible to pay dividends that qualify for federal
income taxation at rates applicable to long-term capital gains. The Fund may invest in preferred stocks that are rated below investment grade. The Fund
may also invest a portion of its assets in stocks and other securities that generate fully taxable ordinary income, including up to 30% of its total assets in securities rated below investment grade.”
Other salient features of this fund are as follows:
- The fund is managed by the Eaton Vance fund family, one of the oldest and largest fund management companies. It manages nearly $17 Billion in CEFs (Closed-End Fund) assets alone.
- The fund ETG uses roughly 20% leverage, which is not excessive. That said, we know that leverage can work both ways. In a bull market and low-interest rates environment, it can be helpful in boosting income and returns, but it can also hurt the performance in a bear market. Also, we have seen during the past two years that a high-rate interest environment can add a lot of additional interest burden that cuts down on the overall returns.
- The fund has a good past record of long-term performance but nothing stellar. However, the past two years have been turbulent, and 3-year performance has been mediocre at best. Longer term, as of Dec.31, 2023, since inception in 2004, the fund has returned 7.90% on NAV basis, annualized, compared to 9.50% for the S&P500. Based on the NAV basis, it has returned 8.78%, 13.76%, and 7.90% over 10-year, 5-year, and 3-year timeframes, respectively. These results assume that all distributions were reinvested.
- The fund pays a monthly distribution. It also follows a ‘managed’ distribution policy, which would mean that the fund may not always earn enough in investment income and capital gains and pay some of the distribution as ROC (return of capital). At the same time, the fund attempts to make distributions in a tax-efficient manner, so at times, they are characterized as non-dividend distributions (also known as ‘return of capital’).
- The funds’ mandate is to invest globally. It is invested nearly 50% in U.S.-based companies or securities.
- It is a reasonably diversified fund and has a total of 183 holdings (as of Nov.30, 2023), out of which nearly 90 are equity holdings.
- As of Dec.31, 2023, the fund under its management had roughly $1.5 billion in total assets, including the leverage.
- The fund is an actively managed fund and has an expense ratio of 1.18% on the managed assets, including the 0.85% management fee. In addition, the interest expense is roughly 1.52%.
- As of Feb.07, 2024, its distribution yield on the market price was 6.80% and 6.02% on the NAV.
- As of Feb.07, 2024, ETG’s market price offered an attractive discount of -11.43% to its NAV. The 3-year average premium/discount is -6.01%, while the 12-month average is -10.22%.
- The fund’s NAV, as of Feb.07, 2024, stood at $19.95, which is an improvement of 18.75% from its last annual report (Oct.31, 2023).
How does the Fund compare with its benchmark or similar funds?
The fund follows two benchmarks.
- MSCI World Index
- ICE BofA Fixed Rate Preferred Index.
This fund invests roughly 80% in equity and the rest in preferred or fixed-income securities. So, it may be appropriate to account for both indexes in the same proportions to make a blended index.
We will compare ETG with the following two ETFs (Blended) and the S&P 500.
Blended ETFs:
- Vanguard Total World Stock ETF (VT) – 80%
- iShares Preferred and Income Securities ETF (PFF) – 20%.
Chart-1:
Author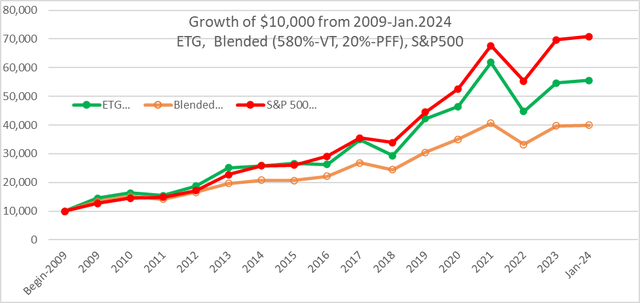
We could perform this comparison only from the year 2009 onwards since most of the World ETFs (including VT) were started in 2008 or after. As we can observe, ETG has slightly underperformed the S&P 500 (SP500), but we have to remember that the S&P 500 has outperformed most funds, especially the global funds, in the last decade. However, ETG performed much better than the blended index during the same timeframe.
Further, ETG is especially attractive if you are withdrawing the income on a regular basis.
Financial Outlook:
Let’s look at the fund’s financial health to see if the fund is earning enough to pay for the distributions. The most recent detailed report that is available to investors is the annual report for the period of Nov. 2022 – Oct. 31. 2023.
Net Investment Income:
The net investment income (or NII in short) is the net income that a fund earns from its investment in the form of dividends, distributions, and interests or derivatives like options, minus all of the fund’s expenses, including management fees, operating expenses, commissions, and interest on leverage, etc. For equity-based funds, especially in high-growth sectors like technology, the NII is not very relevant. However, for fixed-income or bond funds, it is highly relevant. In the case of ETG, it invests 80% of its assets in equity worldwide, and many of them have generous dividends. However, it invests in both dividend-paying and non-dividend-paying stocks. That said, it does generate a substantial amount of income. However, the fund has a lot of expenses as well, including the interest burden that it must pay on the leverage. However, if we take the last four year’s average, after all expenses, the NII pays about 60% of the fund’s distributions. The rest is paid from capital gains, mostly long-term capital gains, and very little from ROC.
Here is what it looks like in terms of NII, Distributions, and Net Assets at the beginning and end of the statement period.
(all amounts are in US $ (except Shares Outstanding); negative amounts are shown inside parentheses, per the Annual report, 12 months ending Oct.31, 2023. We also provide the per-share data and comparison with the year 2022.
Table-1:
Author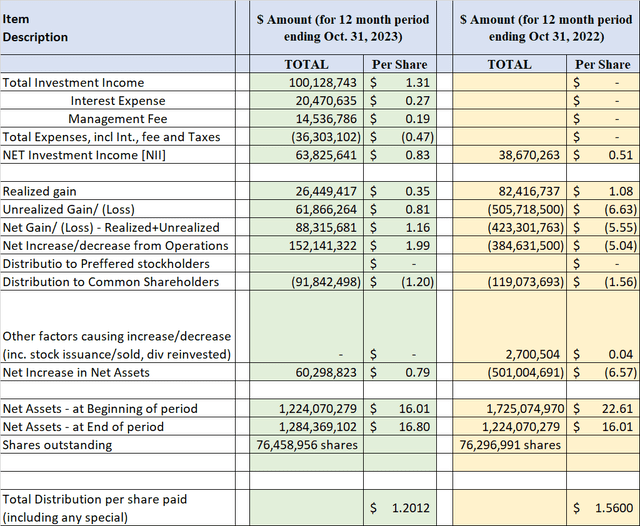
Data source: ETG’s 2023 Annual report, 12 months ending Oct. 31, 2023.
Distributions:
ETG provides a monthly distribution of $0.1001 per share, which comes out to be a yield of 6.80% at current prices (as of 02/07/2024) and 6.02% on the NAV. The fund follows a ‘managed’ distribution policy. The fund’s policy is to make tax-efficient distributions as much as possible. It has paid fairly consistent dividends, but it did reduce the payout in 2022 after increasing it in 2021. The fund tries to keep the distributions less than the total returns over a certain period of time. However, it may be noted that it did reduce the distribution amount during the 2008-2009 financial crisis by about 28%.
So, is the distribution covered?
Table-2: Distribution (from 2020-2023)
Author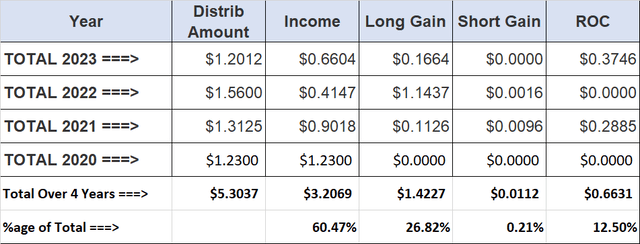
Data source: Fund’s Literature.
The regular distribution amount is $1.2012 for the year ($0.1001 a month). We checked the distribution record for the last four years and found that some ROC (return of capital) was paid during this period. As such, it amounts to a very small percentage of the total, only about 12.5%. Besides, the fund specifically uses ROC as a tool to keep the distributions tax-efficient.
That said, since the investment income alone is not sufficient to cover the distributions, the fund depends on good years to generate capital gains to sustain the dividends. As long as the down cycles are not multi-year prolonged ones, this fund should do just fine.
Since its inception nearly 20 years ago, the fund has gone through many market conditions and economic cycles. As stated earlier, they did cut the distributions in the 2008-2009 cycle by about 28%, but other than that, they have a pretty good record. They also cut in 2022 after increasing it in 2021, but the overall impact was minimal, and basically, it has been paying at the same rate since 2009. We can rate the dividend reliability and consistency as pretty strong, but there has been no growth in 15 years.
Discount/Premium:
The fund is currently trading at a very attractive discount of -11.50% (to its NAV, as of Feb.06, 2024); however, it has traded at a similar discount of -10.2% during the last year. However, the current discount is much better than its 3-year average discount has been -6.01%.
We present below the three-year history of premium/discount. As visible in the chart, the fund has spent most of its time in the discount area, except for a very brief period in 2022. In that respect, the current discount is at par with its recent and not-so-recent history. Moreover, we should always look at both the premium/discount and the overall valuation of the fund within its sector.
Chart-2: ETG – Premium/Discount Chart (over three years)
Author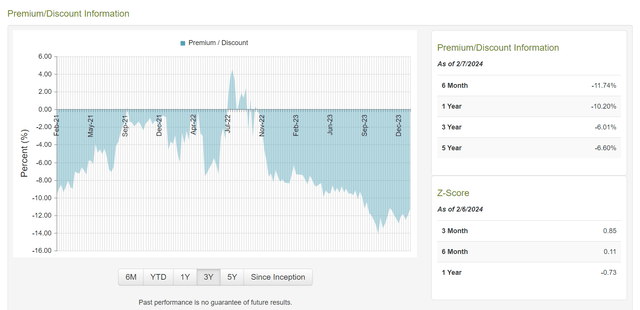
Courtesy: CEFConnect.com
Funds Holdings:
The fund is global in nature, and it is mostly invested in equity holdings. In terms of holdings, the fund is quite diverse, as the number of holdings stood at 183 as of Nov. 30, 2023. The top 10 holdings make up only about 24% of the assets. The top 10 holdings as of Nov. 30, 2023, and asset composition are presented below. Some of the top equity holdings are Microsoft (MSFT), Google (GOOGL) (GOOG), Amazon (AMZN), Apple (AAPL), Nestle (OTCPK:NSRGY), Adobe (ADBE), and ConocoPhillips (COP).
Table-3:
SeekingAlpha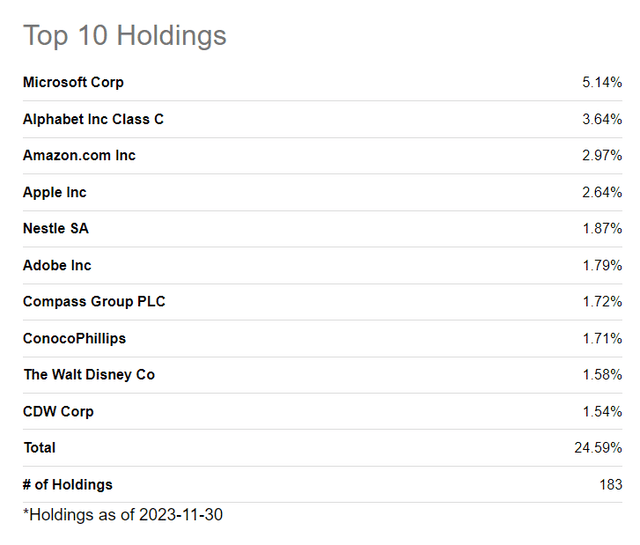
Chart-3B:
SeekingAlpha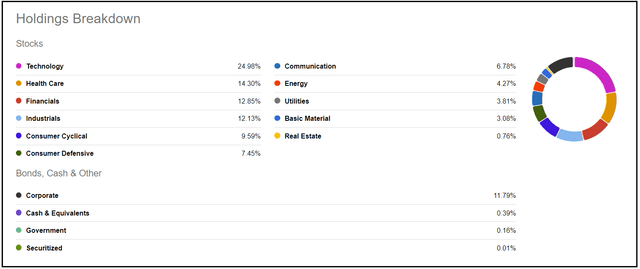
Performance and Valuation:
If you are looking for reliable and relatively stable nearly 7% income and decent total returns over the long term, you should consider this fund. This fund is not going to beat the S&P 500 (most of the time), but that is not the objective of the fund either. Moreover, we have seen that in the last decade, world markets have not kept up with the U.S. market. But that can change in the future. This fund gives you instant diversification in over 20 countries, with over half invested in the U.S.
In the table below, we compare several performance-related metrics with one other fund from Eaton Vance and the S&P 500. We have also included the ‘Blended’ hypothetical benchmark (with 80% VT and 20% PFF). The following are included:
- ETG
- Eaton Vance Tax-Advantaged Dividend Global Dividend Income Fund (EVT)
- Blended fund (80% VT, 20% PFF)
- Vanguard Total World Stock Index ETF (VT)
- iShares Preferred and Income Securities ETF (PFF)
- SPDR® S&P 500 ETF Trust (SPY)
Table 4: (Data – period as specified, otherwise as of Jan. 31, 2024)
Item Desc. | ETG | EVT | BLENDED (80% VT, 20%PFF) | S&P 500 | |
Annualized Return (CAGR) From 2005-2023 | 7.58% | 8.28% | N/A | 9.50% | |
Annualized Return (CAGR) From 2009-2023 | 11.98% | 13.02% | 9.62% | 13.82% | |
Dividend Yield% (as of 02/07/2024) | 6.80% | 8.08% | 2.62% (avg.) | 1.33% | |
Max. Drawdown (2008-2023) | -68% | -66% | N/A | -49% | |
Std. Deviation (2008-2023) | 24% | 24% | N/A | 16.22% | |
10-Year CAGR (NAV) | 8.78% | 9.22% | 7.28% | 11.88% | |
5-Year CAGR (NAV) | 13.76% | 11.82% | 10.17% | 15.53% | |
3-Year CAGR (NAV) | 7.90% | 7.20% | 4.29% | 9.85% | |
Fees (excluding interest) | 1.18% | 1.14% | 0.15% ((AVG)) | 0.09% | |
Leverage | 20% | 20% | 0% | 0% | |
No of holdings | 183 | 156 | 10,335 (combined) | 504 | |
Assets (total) | $1.89 Billion | $2.2 Billion | $58 Billion ((COMB)) | $484 Billion | |
Allocation | 80% equity (50% domes.), 20% Preferred and Fixed Income | 80% equity (80% domes.), 20% Preferred and Fixed Income | 80%-world equity, 20%-Preferred | Largest 500 US companies |
Note: Some of the data (e.g., number of holdings and leverage) may not be current as of Jan. 31, 2024.
Now, the past performance looks decent but not exceptional. The other fund, EVT, has better performance, but the main difference is that EVT has an 80% allocation to U.S. equity and 20% to International (compared to 50% for ETG). The U.S. market has outperformed the world markets for more than a decade now. Even then, the management has done a reasonably good job of maintaining the funds’ NAV over 20 years. As such, the current NAV is almost at par with the inception NAV, but the fund has distributed nearly $27 in distributions since 2004.
Risk Factors:
Investors need to be aware of certain risk factors that are associated with this fund and CEFs in general. Risk factors could be summarized as follows:
- ETG’s near to mid-term future performance may be impacted by the movement of interest rates. However, this is not unique to ETG. Moreover, as of now, all indicators and expectations are pointing to interest rates going down in 2024., in spite of the Fed’s tough speak. Also, since this fund carries substantial leverage, there is a large impact on the interest expense.
- If high interest rates somehow were to rise from here or stay higher and longer than expected (there is at least some possibility), then that would be a headwind for this fund, especially on the interest burden.
- The fund has nearly 50% global exposure (non-U.S. equity and preferred/fixed-income). It is both an advantage as well as a risk.
- This fund is more volatile compared to the S&P 500, likely due to 20% leverage.
- The general risks such as the geo-political situation.
- Market risks: The possibility of the occurrence of a recession in 2024, though most market participants are expecting a shallow one if that happens.
Concluding Thoughts:
The fund offers several attractive features to income investors and retirees.
- The fund provides a high enough current distribution (at 6.80%) but not too high that would jeopardize the reliability of distributions. The fund has to earn only 6% on an NAV basis to pay the distributions. The fund’s management attempts to keep the distributions at a very safe margin compared to the total returns expected from the fund.
- The past record is reasonably good. But, if you look at many different periods, it is about 1.5% lower than the S&P 500. Nonetheless, to keep things in perspective, in the last few years, the S&P 500 has outperformed nearly most funds, especially global securities. We can expect 8% to 10% of total returns from this fund on a long-term basis.
- With the improvement in market sentiment, the valuation has gone up nearly 20% in the last three months, but the discount is still at very attractive levels (>11%), meaning we would be getting the underlying holdings at an 11% discount. Moreover, NAV has improved much more than the market price.
- If you want some diversification and global exposure, this fund is a good place to start with. If you would like to have less exposure to international equities, its sister fund, EVT, may be a better option. The S&P 500 has had a tremendous run during the last decade. Will that continue in the next decade? It is quite possible, but things tend to change over time, and international securities and assets will likely catch up in the coming years.
If you are a new buyer, you could buy the first lot of shares as a placeholder and buy more whenever a better opportunity appears. The existing owners should hold the shares as we consider this to be a long-term holding that should serve its owners reasonably well. Also, with interest rates heading lower, it should provide a decent appreciation as well.
")


")


