Lighthouse Films
AGNC (NASDAQ:AGNC) invests heavily in Agency MBS and TBA mortgage assets by purchasing lower interest bonds, followed with hedging in order to manage risks from interest rate volatility. In defining each, first Agency MBS:
“Agency MBS are created when residential mortgage loans that meet agency underwriting guidelines are securitized into a pass-through security. Investors in pass-through securities receive the underlying loans’ principal and interest net of servicing and guarantee fees.”
Second, TBA mortgage position is defined as a “[TBA] trade [that] effectively [is] a contract to buy or sell mortgage-backed securities (MBS) on a specific date.”
Articles written on Seeking Alpha by us and others concerning AGNC, and the accompanying interest rate environment, bought considerable passion from both sides, some strongly defending while others strongly condemning investments in this business model. Both sides have strong points from which to create arguments. Our intent in this article follows our past beliefs such as AGNC: A Coming Turning Point For Investing, which considers the present and the future. Our interest is in what signal does the high dividend flash. It is a warning, or is it a disguised green light? Like a wall built by soccer players in helping defend the goal from a direct kick, we hope this offers reasonable protection for the goalie (investor), from which to develop a fair evaluation. But, before we set that wall, it should be noted that a significant number of comments from management are included targeted around factual marketplace assessments of which we don’t have direct data access. We have to take their word.
The Marketplace
With AGNC, investors sometimes seem confused about the relatively complex environment of this business model, at least we have. In the very best light, it is brutal. So, our first order of business is to include on-line locations for charts/graphs of critical relationships that management seems concerned. We begin with a bullet list:
- 10-year treasury yield.
- 5-year treasury yield.
- Agency MBS spreads compared with treasury yields.
- Bloomberg Long Treasury Bond Index.
- Highly rated corporate debt instruments.
We also welcome from others their links and references.
A yield curve link on a daily basis can be found at US Treasuries Yield Curve. A sample graph follows.
U.S. Treasuries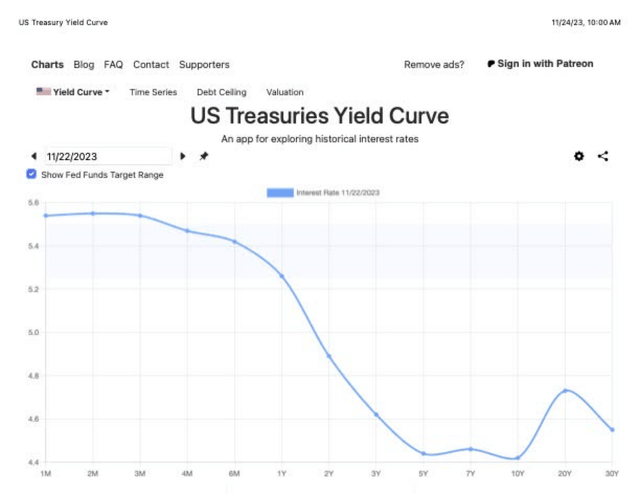
Next is a graph of Agency MBS vs. Treasuries.
Fred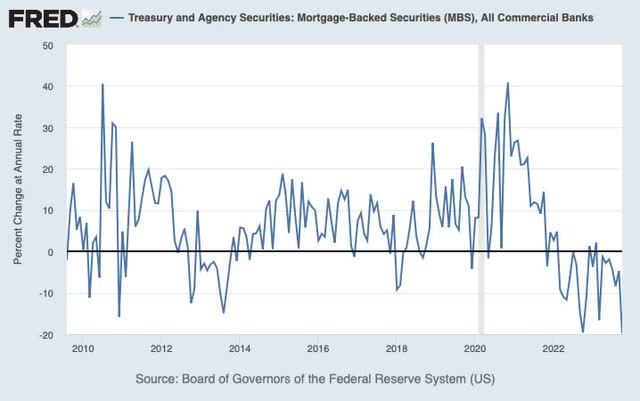
For those who have access to Bloomberg’s Long Treasury Bond Index, this link opens a graph. The symbol is LUTLTRUU: IND. The news organization generally locks this data from non-subscribers. We are a non-subscriber.
Next, we include a graph from Schwab of Investment Grade Corp. Bonds.
Schwab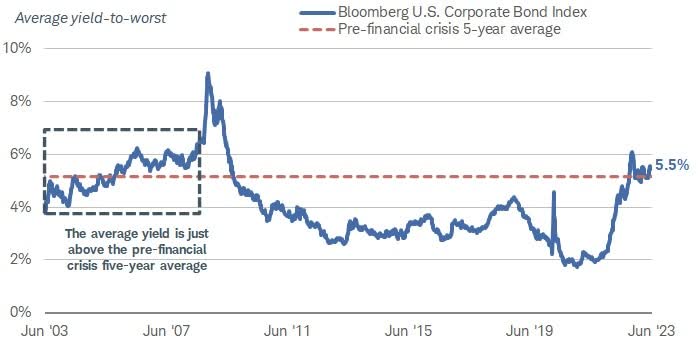
Again, we welcome additional source references from which investors may view for themselves, data deemed critical.
Management Comments
With the beginning of a base understanding in place, our next task evolves clearly summarizing managements comments on the marketplace. Management noted, “The treasury market continues to be in the midst of a historic multi-year repricing event.”
With respect to Agency MBS, management noted:
- “In environments like this when treasury prices fall abruptly and the market struggles to find its new equilibrium, Agency MBS typically underperform[].”
- Once the challenging period ends, the “investment opportunity in agency MBS on both an unlevered and levered basis is” bullish.
- For the last six months, the spread between Agency MBS and blended portfolios of five and 10-year treasuries ranged between 150 and 195 basis points.
- MBS is significantly “above highly rated corporate debt instruments.”
With respect to treasuries, management noted:
- “To put the move in context, the increase in the 10-year treasury yield over the last three years is the second largest ever recorded over such a short time period. In percentage terms, the treasury market has never experienced anything like this.”
- Agency MBS spreads when compared with treasuries “widened 20 to 25 basis points.”
- Unlevered, MBS yields 7% with the full backing of the Federal Government.
- A yield on MBS is at least 150 basis points higher than all treasury bond yields.
- The recent Treasury rate higher move began early in the quarter from growing fiscal deficits.
Next, with respect to the Bloomberg Long Treasury Bond Index, management added this:
- “The Bloomberg Long Treasury Bond Index which tracks maturities of 10 years or more, has experienced a total return loss of close to 50% over the last 2.5 years, a loss equal to what the S&P 500 experienced following the dotcom bust in 2000.”
- Bearish bond sentiment “accelerated late in the quarter following a hawkish message from the Fed. . . .”
And finally, highly rated corporate bonds yields are materially lower than Agency MBS on an unlevered basis. This fact should hit hard investors with respect to opportunities for more lucrative returns and dividends.
Management, also, noted that after the September FOMC meeting announcement with the Fed making clear, low-end-of-the-curve rates would remain higher for a longer duration, 5-10-year yields increased by 45 and 73 basis points with the low end remaining unchanged.
The environment is understated when using the word brutal. Investors must ask, why invest?
Quarter Results
In this craziness, AGNC reported a mixture of results. The results include:
- Lost $1.02 in equality value from rate volatility and wider spreads.
- Leverage still at 7.8 even with the precipitous drop in asset value.
- $3.6 Billion cash.
- Dollar roll income, excluding catch-up amortization, at $0.65 per share. (Down $0.02 quarter over quarter from higher lending costs.) Remember, this represents the cash generated from assets.
- Added hedges at the 10% point in the curve. (“70% of our hedge portfolio duration dollars are at the seven-year or longer points on the yield curve with approximately 50% of our duration in Treasury-based hedges.”)
Management also noted that, “Agency MBS is very favorable. Spreads have decoupled from treasuries and corporates due to supply and demand technical factors that we expect will ease over time. . .” A longer discussion of management’s position on MBS follows,
“This is especially remarkable given that the fundamentals for Agency MBS have rarely looked as compelling as they do today. Organic agency supply is minimal, prepayment risk is deeply out of the money and repo markets for Agency MBS are deep and liquid. With spreads as wide as they are today, we believe investors in Agency MBS are well compensated for elevated rate volatility over the near term.”
On other interest rates spreads, management noted that CDX IG spreads were at 15-year averages. But historic differences in spreads creates weakness in valuations.
Comments on Dividends
Let’s go to the horse’s mouth for comments of dividends beginning with,
“As I have mentioned many times, one of the primary factors that we evaluate in setting our dividend is the economic return that we expect to earn on our portfolio at current MBS valuation levels. . ..”
“Said another way, as of the end of the third quarter, we needed to earn a 16% return on our total tangible equity capital base of $6.9 billion in order to satisfy all of our operating costs and dividend obligations. . .. the expected levered return on Agency MBS depending on coupon is in the mid-teen to low 20% range before convexity and rebalancing costs.”
“And the subsequent decline in tangible net book value per share and stock price, the dividend yield on our common stock has increased notably.”
With investments still earnings high levels of cash, management isn’t expecting cuts in dividends.
Interest Rate Position
For investors, we felt it helpful with including graphs on the rate curve for the last day of the quarter, the day of the announcement, the day of earnings and a more recent day.
Beginning with a graph for 9/29, the last day of the quarter.
U.S Treasuries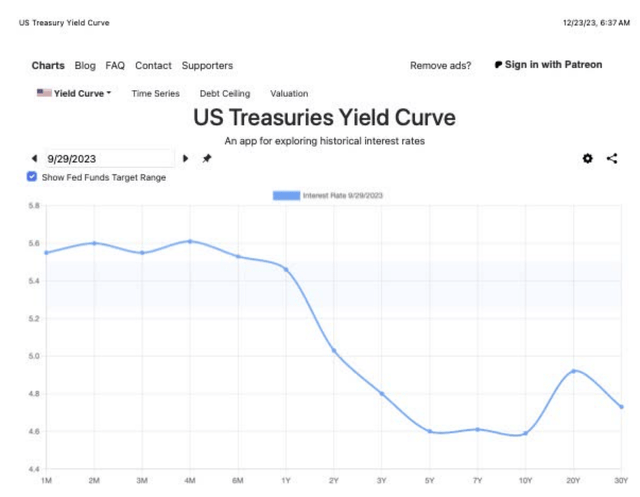
Followed by a graph for 10/23, the day management posted the asset value warning.
U.S Treasuries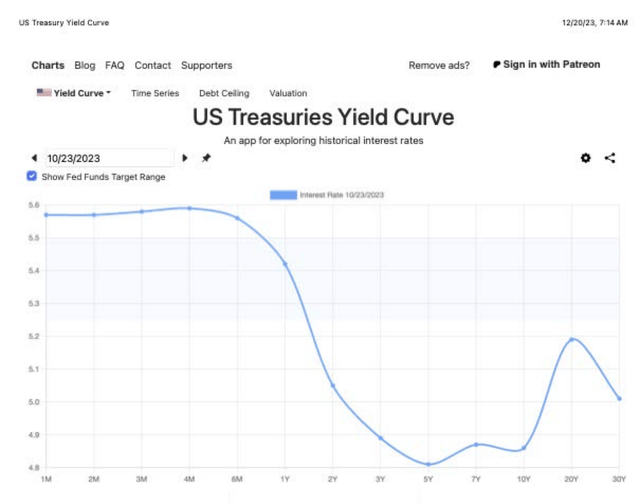
Now, a graph for 10/30, day of the earnings report.
U.S Treasuries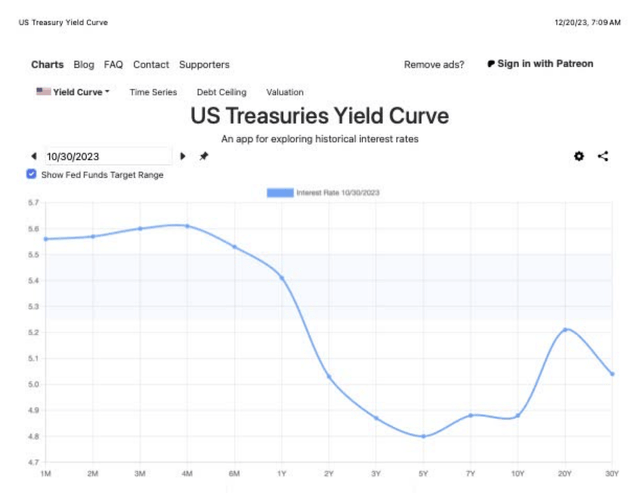
And finally, a graph for 12/19.
U.S Treasuries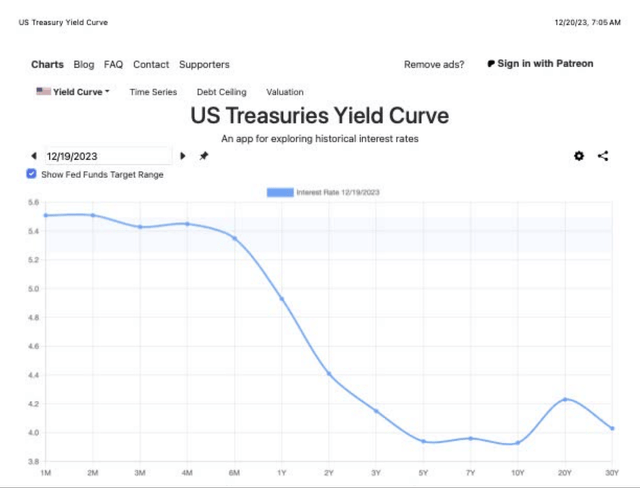
Taken in aggregate, the steep increase in the long-term interest rates continued through the 3rd quarter into October. From that time since the report, it has significantly flattened. The stock price followed respectively from the high $6s to $10.
Risk
In our view, a Government shutdown is coming early next year and will add risk similar to September. The last one caused significant increased volatility. Expect the same again. The House passed a short-timed continuing resolution in mid-November with this caveat, in January, the Senate will receive twelve appropriation bills including instructions that we will negotiate changes, but only with accompanying revenue neutral approaches. This isn’t going to be received kindly in the Senate. It is also the Senate’s only choice. The House won’t pass unfettered costs. On the flip side of this budget issue will be better spending controls and lower deficits, a positive going forward.
A last concern of ours involves a lack of understanding of at what volatility levels does AGNC fold?” We don’t know. There is a breaking point that exists for all business, and this is no exception.
Regardless, we rate AGNC a buy with the high yield and believe that it won’t get cut any time soon. The assets even when lower in value return the same cash regardless of valuation. Even though the stock price does move with asset valuation, the cash for dividends doesn’t. We hold a very large position with most of it at $10. We do have some short $11 calls against our position. The hedged defense and constant cash flows offer the investor (goalie) a needed protective wall.


