Eoneren
Introduction
Interest rates are expected to remain high for longer. As a result, volatility has recently entered the markets for income-generating investments. As a long-term investor, some of my investments are in stocks which can be categorized as such. Although Consolidated Edison (NYSE:ED) was never a pure income play for me, some of its peers have been hit hard by this volatility. As I will analyze in this article, ED’s stock metrics seem to suggest that its shares have hardly been affected by the rising interest rates. Comparing the yield and dividend growth of Consolidated Edison, it seems unlikely that this situation will remain the same if interest rates continue to rise.
Interest rate turbulence
The FED interest rates have gone up dramatically over the last 2 years, as you can see in the graph below:
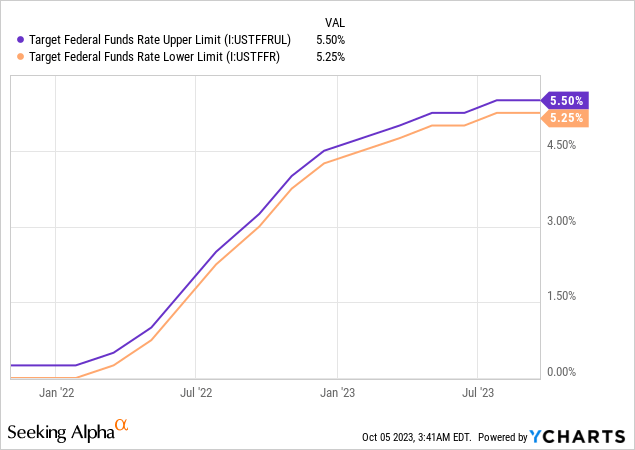
Graph 1: FED interest rates upper and lower limit over the last 2 years (source: YCharts)
As a result of these interest rate increases, US long-term debt is now yielding more interest than the yearly dividend of many stocks. TINA has definitely disappeared. For some investors who are focusing on generating yearly income from their investments, this makes investing in US debt more attractive. Naturally, this has led to drops in prices of relatively slow-growing and/or high-yielding stocks like REITs and Utilities.
Let us take a look at how shares of a group of utility companies performed during the last 2 years:
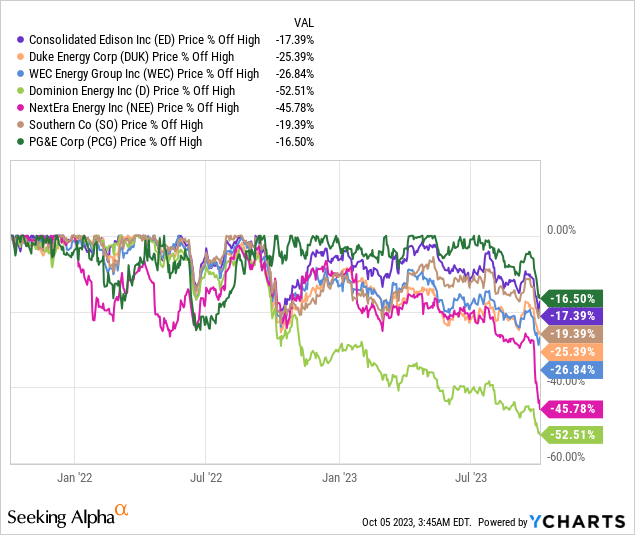
Graph 2: Utility companies price % off high over the last 2 years (source: YCharts)
As you can see in the graph, some utility companies have been hit particularly hard, such as Dominion Energy (D) and NextEra Energy (NEE). In the case of NextEra, this has to do with the turbulence because of their subsidiary NextEra Energy Partners (NEP), but this was also directly caused by the higher interest rates. Please note that the graph lists % off high and the not total performance of these stocks during the past 2 years (these two can be dramatically different).
In my portfolio, I also own income-focused investments like REITs Realty Income (O) and W.P. Carey (WPC). These stocks were hit much worse by the interest increases (and in the case of WPC by the badly-conceived spinoff of their office portfolio). In the following graph, I list some REITs and Hannon Armstrong (HASI), which is an energy and infrastructure-linked investment company which in many ways has behaved like a REIT.
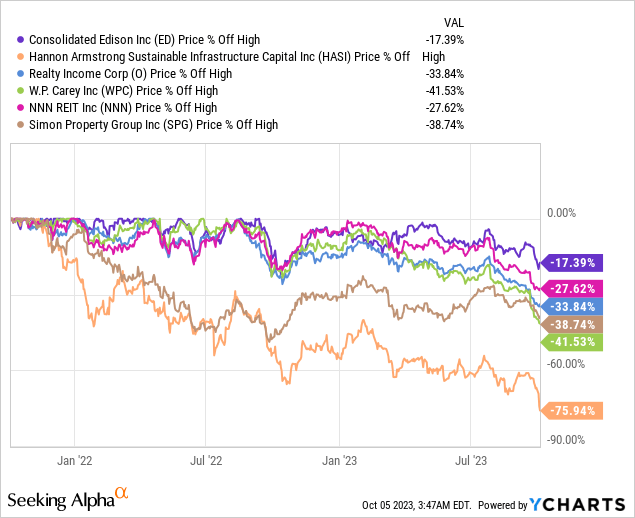
Graph 3: REITs price % off high over the last 2 years (source: YCharts)
As we can conclude by looking at both graphs, the price of Consolidated Edison has come off very little compared with both its peers and REITs. Of course, this still means that shares of ED will likely take a hit if interest rate expectations continue to deteriorate. But relatively speaking, Consolidated Edison seems to have remained a beacon of stability.
Share price and valuation
As we can already see in the two graphs above, Consolidated Edison’s shares have dropped more than 17% since its all-time high in September 2022. If we take a closer look at the past 2-year time period, we can see that ED’s shares have indeed dropped in value. But the late drop in value was less than what happened during the period between September and November 2022. Although a drop of 17% is nothing to sneeze at for a ‘safe’ investment like Consolidated Edison, considering the circumstances I believe shares have held up very well until now.
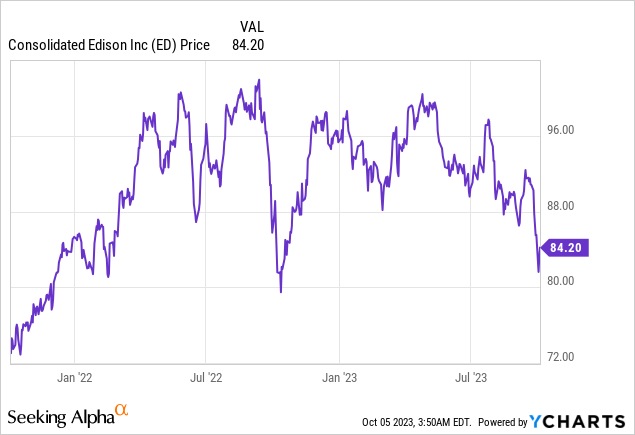
Graph 4: Consolidated Edison share price over the last 2 years (source: YCharts)
For a steady income-generating company like Consolidated Edison, the price-to-earnings ratio can be a good metric to determine the relative valuation of the company. In graph 5 you can see ED’s normalized P/E ratio over the last 5 years. As we can see, P/E ratio peaked around 2020. Currently, ED’s P/E ratio seems very normal when looking at the graph. Historically speaking, I believe a P/E ratio of 17.5 for Consolidated Edison is a fair ratio under normal circumstances. But current circumstances are not normal.
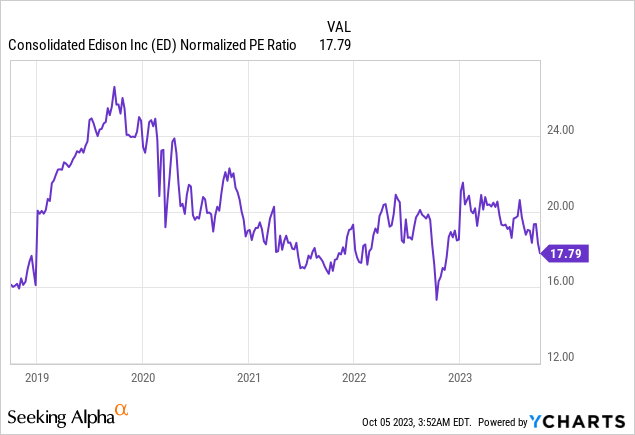
Graph 5: Consolidated Edison normalized price-to-earnings ratio over the last 5 years (source: YCharts)
Dividend
One of the reasons for investing in Consolidated Edison is its growing dividend. As we can see in the graph below, the last 10 years the company has grown its dividends like clockwork. In fact, the company has increased its dividend for 46 consecutive years. There have been no huge increases during the last decade, the company raised its quarterly dividend from 60.5 cents in 2013 to 81 cents this year, which is an average annual increase of about 3%.
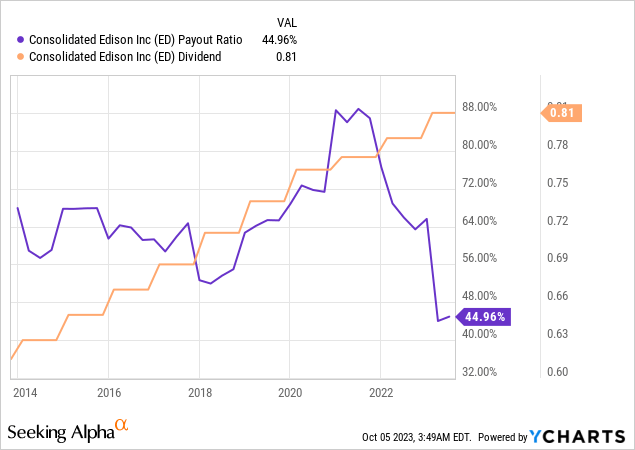
Graph 6: Consolidated Edison dividend and payout ratio over the last 10 years (source: YCharts)
Paying growing dividends is one thing, being able to afford these dividend increases is another. Consolidated Edison’s payout ratio depicts which percentage of their earnings are paid out to shareholders in the form of dividends. I believe this ratio looks very healthy over the years. While it was quite high between 2020 and 2022, peaking just below 90%, it has come down to a much healthier level lately. Looking at this graph I believe it is likely that the company will be able to modestly raise its dividend during the coming years.
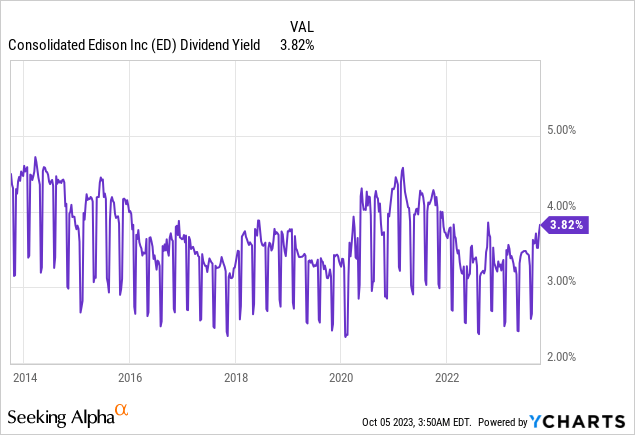
Graph 7: Consolidated Edison dividend yield over the last 10 years (source: YCharts)
Looking at the dividend yield of Consolidated Edison over the last 10 years, the current 3.8 percent yield looks to be somewhere in the middle of the range which is normal for the company.
Earnings
All of the metrics that we took a look at suggest that Consolidated Edison is a very stable company that seems immune to rising interest rates. In a way, shares of stable and safe-yielding companies like ED can be considered to be bond substitutes. That is unless the underlying companies are growing quickly. Let us take a look at the normalized diluted earnings per share of Con Edison over the last 10 years:
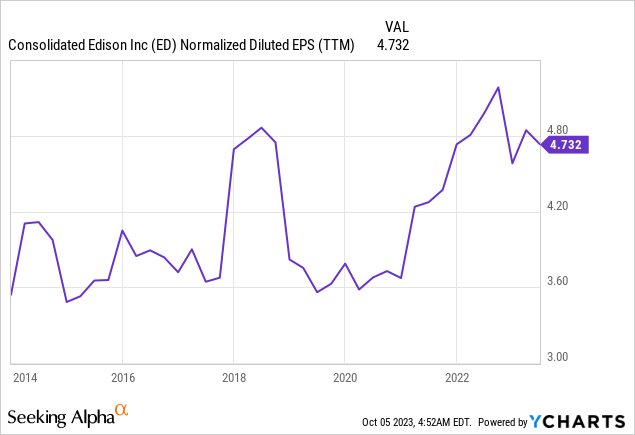
Graph 8: Consolidated Edison normalized diluted earnings per share over the last 10 years (source: YCharts)
Earnings per share grew from about $3.57 to $4.73 during the last decade, which is an average annual increase of about 3%. Not coincidentally, this is almost exactly the same average annual increase as the dividends of ED over the last decade. In my opinion, this strengthens the case of looking at ED as more of a bond substitute.
Is ED immune to rising interest rates?
Consolidated Edison’s stock metrics look as if nothing has happened. But although the company has remained stable as always, the interest rate environment has considerably changed during the last 2 years.
Consolidated Edison yields 3.8% and both its dividend and its earnings per share have grown by an average annual percentage of 3% during the last decade. With FED interest rates currently at 5.25-5.5%, this makes ED’s shares look expensive.
Even though the shares of Consolidated Edison have held up well during the current rising rate environment, I feel this situation can change at any time, especially if interest rates rise further or remain high for longer than expected. In this case, I believe a yield of closer to 4.5% would be logical. If we assume that ED will increase its quarterly dividend to 83 cents next year, a yield of 4.5% would mean a fair share price of $74. Although Consolidated Edison is a rock-solid company, I believe its shares have room to drop by 10% from current levels.


