Donny DBM/iStock via Getty Images
By Reed Cassady, CFA, Sam Peters, CFA, & Jean Yu, CFA
The Internal Engine of Returns
Market Overview
We have previously written about how a lifetime of being a pilot can influence how one approaches portfolio management. The basic principle of flying is to generate lift, while the basic principle of portfolio management is to generate attractive risk-adjusted returns. In both cases achieving these goals requires adapting to highly dynamic environments and making the most of opportunities that more than offset for volatility and turbulence. The key is to try and consistently execute on the investment process engine while positioning the portfolio for the big uplifts that come when extreme market positioning shifts in our favor.
Internal Engine of Returns
The goal of our valuation-disciplined investment process is to be an engine of returns in all environments. The process is very bottom up, security specific and driven by internal factors. At its core, we are looking for opportunities where market price and our estimate of business value are at least 30% apart. When we think we have identified a potential mispricing, we immediately ask ourselves what the market is getting wrong and why future fundamentals will turn out better than what is currently priced. This constitutes the engine that provides the internal lift of our portfolio: companies that can compound intrinsic business value over time by generating free cash flow and allocating that cash flow intelligently to attractive return opportunities or returning capital to shareholders. When we are correct, returns are generated as price and value converge to an increasing business value. In this environment, where most stocks outside the big index favorites are being ignored, we are finding many opportunities to put this theory into action.
“In this environment, where stocks outside the big indexes are ignored, we are finding opportunities to put theory into action.”
One example of our internal return engine is our continued large position in American International Group (AIG), which we have owned for roughly 10 years. We originally bought AIG at a greater than 30% discount to our initial estimate of business value. This entry point assumed minimal improvements in the business but allowed us to absorb some inevitable downdrafts along the way that we took advantage of to build our position. The key, however, is that during this period AIG management dramatically improved their business. The company has compounded intrinsic business value per share at a double-digit rate by reducing risks as management overhauled their underwriting process, strengthened their balance sheet, cut expenses and operational complexity and structurally improved returns on equity. A major source of added lift came from intelligent capital allocation: shares outstanding have been more than cut in half during this period, as management bought back roughly 5% of the company annually below intrinsic business value.
However, this valuation-driven return engine can only create so much lift on its own. We are always looking for big opportunities to create external lift in our returns from dramatic shifts in markets. The first comes from exploiting market extremes, where the long-term probabilities are very much in our favor, while the second comes from investor underreactions to big shifts in pricing power that can be exploited through our valuation-driven lens.
Exploiting Market Extremes
The market has been recently serving up some very notable and exploitable historic extremes. Big returns in markets are typically made when you correctly identify and exploit an outcome which the market has priced close to a zero probability. While this strategy is difficult to execute, as markets are typically the best system for pricing probabilities, there are occasions where markets experience diversity breakdowns that misprice the likelihood of mean reversion. We see an example of this reflected in the historic extremes in current market concentration (Exhibit 1). The market is effectively pricing an almost certain probability of continued historic concentration, yet it is easily observable that these extreme concentration levels have always reversed. The key is understanding what happens when it does reverse, and are we seeing any signs of it?
Most investors assume that when market concentration reverses the market will collapse, but the historical precedent is more nuanced. In each of these seven cases of excessive market concentration identified since 1925, price momentum took off like a jet as markets reached peak concentration, only to reverse violently as concentration decreased. However, in every episode of these big momentum reversals, the previously low-momentum laggards of the S&P 500 (SP500, SPX) – now showing a positive momentum factor according to the Farma French model in the wake of the reversal – went on to generate positive absolute returns, with an average return of 27% over the following 12 months. In other words, rather than crashing, previous concentration and related momentum reversals are an opportunity for the laggards to catch up.
Exhibit 1: Market Concentration is Very Elevated vs. Past Century
As of March 14, 2024. Source: Compustat, CRSP, Kenneth R. French, Goldman Sachs Global Investment Research.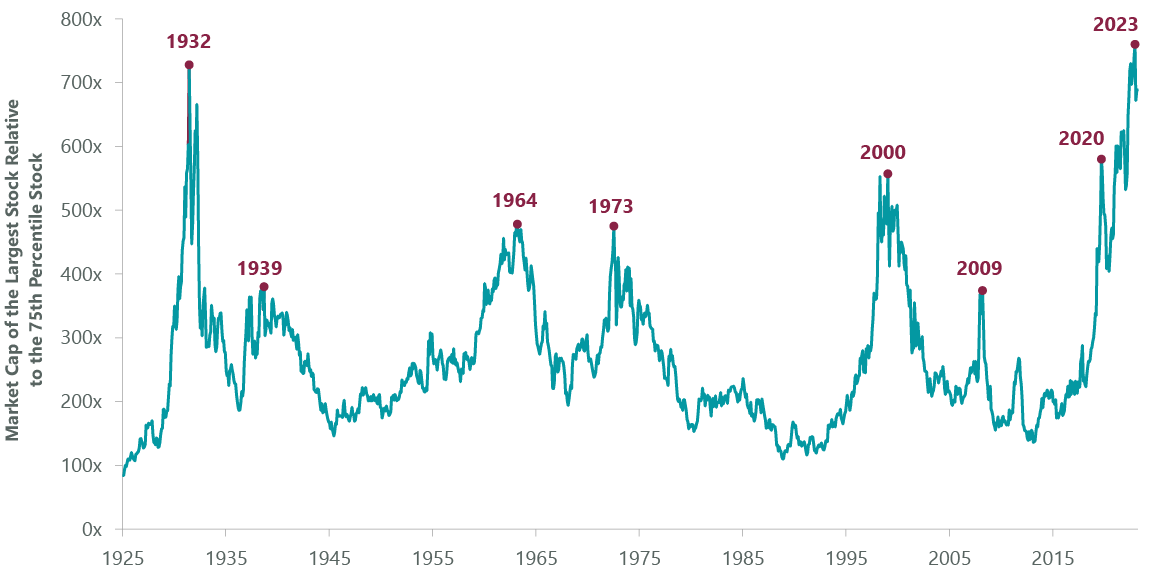
Extreme market concentration is like a world-class magician at a kid’s birthday party: through their intense focus on the magician, the kids lose sight of everything else. This is how magicians work, and right now the market is focusing investors and their precious capital on an increasingly narrow list of stocks. The result is an opportunity to buy great fundamentals at attractive valuations in the laggards beyond most investor’s narrow gaze – a combination capable of generating attractive portfolio lift from our return engine, while maintaining the big external return opportunity that will come from an inevitable reversal that favors laggards.
Another example of an internal engine driving lift was our positioning within the energy sector in the first quarter. While the market doubled down on concentration within big AI winners in the early part of the quarter, the broadening out of performance as the quarter wore on helped drive the energy sector to be the second-best performer and even outpace IT despite consistent investor outflows and record inflows into the IT sector. As a result, our overweight to the sector helped us pull ahead of our value index and catch up to the performance level of the mega caps dominating the S&P 500 Index.
“AI, like all forms of cognition, is power intensive. Investors conditioned to think of digital innovation as purely deflationary may be in for a surprise.”
Based on what we have observed, the probability of an economic soft landing has increased. In a soft landing scenario, we expected that the market would indeed broaden out, requiring low portfolio turnover. So far, so good. However, we have also edged up our probability of a “no landing” scenario and the potential for inflation to cycle higher as financial conditions have gotten even looser, with capital markets rallying across the board and signs of very ample liquidity. In addition, commodity prices are quietly starting to move higher, with oil up over 15% for the quarter, and retaking their role as a driver of cyclical inflation. This scenario is still priced as a dramatically lower probability by the market and Federal Reserve, which continues to signal a series of interest rates cuts in 2024. Should this probability continue to rise it would create serious headwinds for market concentration and momentum, and having attractively valued laggards, especially in commodities, could prove to be very valuable no landing insurance.
AI Demand Creates Value Opportunities
We are also indirectly benefiting from an exponential increase in demand from AI data center growth and due to a shift in higher pricing for power and memory, as this demand is being met by intensifying supply constraints. One of the most powerful fundamental tailwinds for capital-intensive cyclical stocks is higher pricing, and the ultimate benefits are almost always underappreciated by investors – something that creates an exploitable underreaction.
Perhaps the most dramatic evidence of this shift is in power markets, which have not had to deliver any substantial growth in decades. It is estimated that EV and AI growth will require power demand to increase at least 3% annually (Exhibit 2). This may not sound like much, but it will require substantial investments in power generation and grid capacity that only makes economic sense if power pricing inflects dramatically higher.
Exhibit 2: AI Driving a Sharp Increase in Power Demand
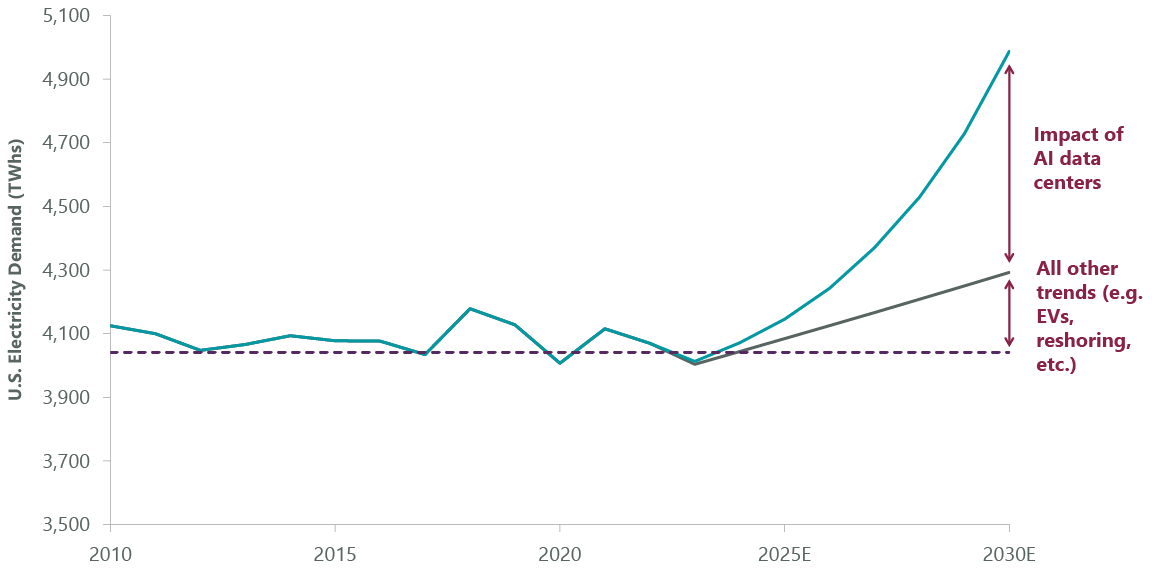
| Source: Wells Fargo Securities, LLC estimates, March 21, 2024 – “AI Power Surge – Quantifying Upside for Renewables & Natural Gas Demand.” Reprinted by permission. Copyright © 2024 Wells Fargo Securities (“Wells Fargo”). The use of the above in no way implies that Wells Fargo or any of its affiliates endorses the views or interpretation or the use of such information or acts as any endorsement of the use of such information. The information is provided “as is” and none of Wells Fargo or any of its affiliates warrants the accuracy or completeness of the information. |
Fortunately, this perfect storm of demand growth colliding with a historically no-growth power industry is being partially offset by the increase in the supply of U.S. natural gas during the shale era. A dominant and growing source of energy for U.S. power generation, shale energy extraction created an exponential increase in well productivity and helped drive supply growth that overwhelmed demand. This non-linear jump in energy supply created a massive tailwind for the U.S. and global economy, while also ushering in a crushing bear market for the energy sector. Even with increasing gas demand, which should accelerate as power demand increases, natural gas prices are currently near all-time lows (Exhibit 3).
Exhibit 3: U.S. Natural Gas Prices Near Historic Lows
As of April 4, 2024. Source: Bloomberg.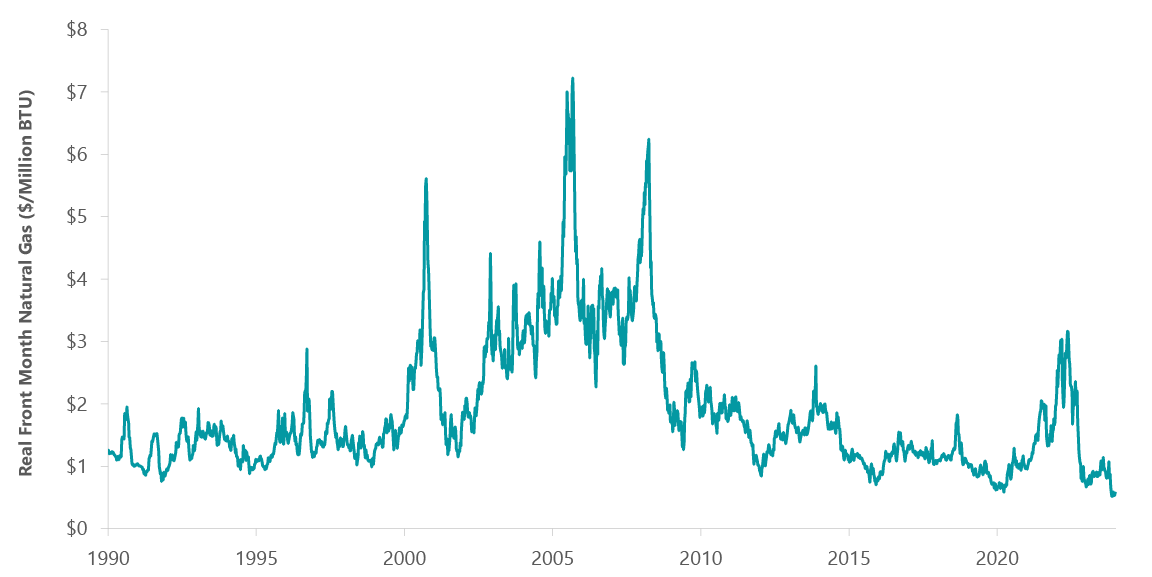
We will be watching what happens to natural gas prices, which are historically extremely volatile, as power demand and export capacity for liquid natural gas (‘LNG’) increase materially over the next few years. We think the risks of upside volatility are rising, which could have a material impact on the broad U.S. economy and cyclical inflation risks. However, we have observed that recessions have rarely occurred outside an energy price spike, and never with a U.S. economy that is powered by plentiful natural gas. AI, like all forms of cognition, is power intensive and investors that are conditioned to think of digital innovation as purely deflationary may be in for a surprise.
Quarterly Performance
Stock selection in the utilities sector proved to be the largest contributor to performance. Our top individual performers included Vistra (VST) and Constellation Energy (CEG), which saw their stocks rise due to the growing expectations for long-term power pricing strength on the back of greater electricity demand from AI development and implementation. In IT, electronic memory manufacturer Micron Technology (MU) rallied alongside other AI beneficiaries. Likewise, cloud computing software company Oracle (ORCL) moved higher as it showed signs of tremendous growth in its signed backlog of bookings, helped in part by increasing agreements with its major generative AI vendor customers.
Conversely, stock selection in the energy sector was a relative detractor. Specifically, oilfield service holdings Baker Hughes (BKR) and Schlumberger (SLB) faced headwinds in the form of lower production levels from OPEC members and the prospect of a temporary pause on new LNG export approvals. Several of our health care companies also faced idiosyncratic challenges during the quarter. For example, Biogen (BIIB), a biotechnology company developing treatments for Alzheimer’s and other neurological disorders, came under pressure after reporting lower than expected revenue growth for the fourth quarter due to weaker than expected sales from its multiple sclerosis and spinal muscular atrophy drugs. However, we believe these challenges are transitory and see room for improvement through its rollout of new products and management’s cost-cutting initiatives.
Portfolio Positioning
We added several new positions during the quarter. Our largest new addition was Bank of America (BAC), one of the world’s leading financial institutions, serving some 66 million consumer and small business clients across the U.S. as well as large corporations, financial institutions and governments globally. We believe that the interest rate pressure that Bank of America faced in early 2023 has subsided, and risks surrounding deposit outflows have abated, which should allow the company to improve its book value and capital growth as well as benefit from a rebound of capital markets activity.
Our largest sell during the period was our position in Pioneer Natural Resources (PXD), a vertically integrated oil and gas exploration and production company with primary shale operations in the Permian Basin. The company announced its intention to be acquired by Exxon Mobil (XOM) and, not anticipating a better offer for the shares, we elected to sell the position.
Outlook
Perhaps the biggest advantage we have in actively executing our investment philosophy is our ability to look away from the powerful pull of tunnel vision. Given record market concentration, we think the benefits of providing diversification for our shareholders have never been higher. The need for market capital to flow to other areas is certainly in place, which should create opportunities, with AI’s emerging demand for turning power into cognition serving as a central example. It will not take much of a shift in concentrated capital to continue to lift laggards into future leaders, and we are taking steps to position ourselves accordingly.
Portfolio Highlights
The ClearBridge Value Equity Strategy outperformed its Russell 1000 Value Index during the first quarter. On an absolute basis, the Strategy had positive contributions across nine of the 11 sectors in which it was invested during the quarter. The leading contributors were the financials and utilities sectors, while the real estate and health care sectors detracted from performance.
On a relative basis, overall stock selection and sector allocation effects contributed to returns. Specifically, stock selection in the utilities, IT, communication services and financials sectors, an overweight allocation to the energy sector and underweight allocation to the real estate sector benefited performance. Conversely, stock selection in the energy, health care, industrials and real estate sectors weighed on returns.
On an individual stock basis, the biggest contributors to absolute returns in the quarter were Vistra, Micron Technology, META Platforms, Constellation Energy and Corebridge Financial (CRBG). The largest detractors from absolute returns were Fluence Energy (FLNC), Biogen, American Tower (AMT), Gilead Sciences (GILD) and Expedia (EXPE).
In addition to the transactions listed above, we initiated new positions in ConocoPhillips (COP) in the energy sector, Tapestry (TPR) in the consumer discretionary sector, Atkore (ATKR) in the industrials sector, Target (TGT) in the consumer staples sector, ICON (ICLR) and argenx (ARGX) in the health care sector, Seagate Technology (STX) in the IT sector, OneMain (OMF) in the financials sector and United Utilities (OTCPK:UUGRY) in the utilities sector. During the period, we exited holdings in Equitable (EQH), Wells Fargo (WFC) and AGNC Investment in the financials sector, Sensata Technologies (ST) in the industrials sector, Schlumberger in the energy sector, Air Liquide (OTCPK:AIQUF) and Royal Gold (RGLD) in the materials sector, Ross Stores (ROST) in the consumer discretionary sector and AstraZeneca (AZN) and UnitedHealth Group (UNH) in the health care sector.
Reed Cassady, CFA, Director, Portfolio Manager
Sam Peters, CFA, Managing Director, Portfolio Manager
Jean Yu, CFA, PhD, Managing Director, Portfolio Manager
Past performance is no guarantee of future results. Copyright © 2024 ClearBridge Investments. All opinions and data included in this commentary are as of the publication date and are subject to change. The opinions and views expressed herein are of the author and may differ from other portfolio managers or the firm as a whole, and are not intended to be a forecast of future events, a guarantee of future results or investment advice. This information should not be used as the sole basis to make any investment decision. The statistics have been obtained from sources believed to be reliable, but the accuracy and completeness of this information cannot be guaranteed. Neither ClearBridge Investments, LLC nor its information providers are responsible for any damages or losses arising from any use of this information. Performance source: Internal. Benchmark source: Russell Investments. Frank Russell Company (“Russell”) is the source and owner of the trademarks, service marks and copyrights related to the Russell Indexes. Russell® is a trademark of Frank Russell Company. Neither Russell nor its licensors accept any liability for any errors or omissions in the Russell Indexes and/or Russell ratings or underlying data and no party may rely on any Russell Indexes and/or Russell ratings and/or underlying data contained in this communication. No further distribution of Russell Data is permitted without Russell’s express written consent. Russell does not promote, sponsor or endorse the content of this communication. |
Original Post
Editor’s Note: The summary bullets for this article were chosen by Seeking Alpha editors.
Editor’s Note: This article discusses one or more securities that do not trade on a major U.S. exchange. Please be aware of the risks associated with these stocks.


