

Userba011d64_201/iStock via Getty Images
Volatility Is A Normal Part of All Trends
The S&P 500 (SPX) gained a lot of ground after a May 30 article noted multiple-sector strength says S&P 500 could move higher. All trends have countertrend moves, which means red days/givebacks are normal and to be expected.
CCM / Stockcharts.com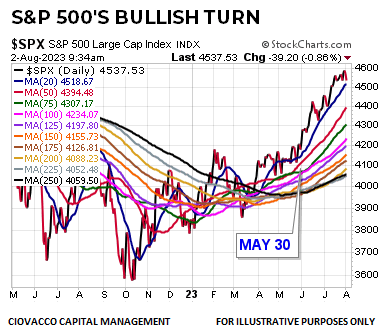
Distracted By Countertrend Moves
When the odds are favorable, as they are today, investors’ focus should be on the sustainability of the long-term trend. Positive longer-term trends make a series of higher highs and higher lows as shown in the 2011-2015 S&P 500 chart below.
CCM / Stockcharts.com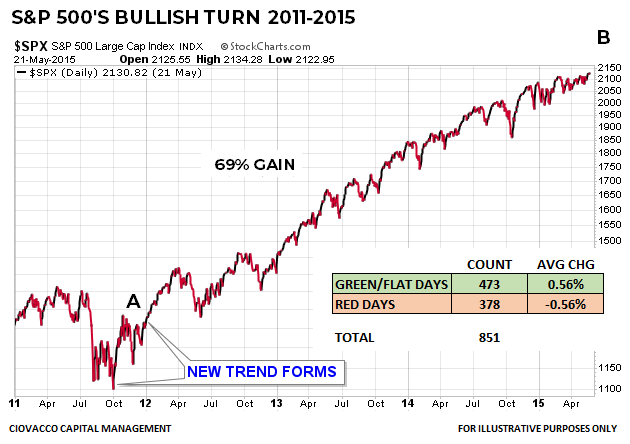
In October 2011 (above), the S&P 500 bottomed and began to form a new and sustainable uptrend. The longer-term trend was clearly up between January 1, 2012 and May 21, 2015. Between points A and B the S&P 500 gained over 69%. Between points A and B there were 851 trading days; 473 of them were green or flat and 378 days were red. Thus, we learn very little about the sustainability of a bullish trend from red days, normal pullbacks, or corrections. That concept applies to all timeframes. The market never drops for no reason, meaning there were countless things to be concerned about between 2012 and May 2015, and yet the S&P 500 gained over 69%.
Same Concepts Apply To Secular Trends
A recent demographic analysis supports the theory that in October 2022 the S&P 500 resumed a secular bull market that began in 2013. Demographics tell us to be open to a long-term bull market that lasts until 2034 or 2035, with some significant corrections along the way. In this article we will examine the S&P 500 monthly Ichimoku Cloud charts. Ichimoku Clouds look complex, but they are very easy to understand. We will focus on pattern recognition. Patterns are relevant for investors since they reflect human behavior.
Secular Stagnation 1930-1949
The S&P 500’s price action between 1930 and 1949 looks nothing like a secular bull market. Secular bear markets or long-term periods of economic and market stagnation share numerous characteristics: (a) the S&P 500 typically cannot make a stand at the blue 50-month moving average, (b) price tends to oscillate above and below the 50-month, (c) the slope of the 50-month is often negative, (d) price spends a considerable amount of time below a downward sloping 50-month, and (e) the Ichimoku Cloud typically turns red.
CCM / Stockcharts.com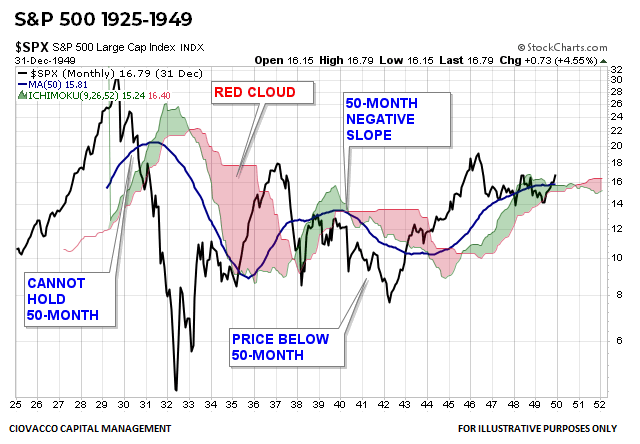
Secular Bull Market 1950-1973
Does the chart below look discernably different from the chart above? The answer is yes. During a secular bull market, the following characteristics are common: (a) the S&P 500 typically makes a stand near an upward-sloping 50-month moving average, (b) price tends to stay above the 50-month, (c) the slope of the 50-month tends to remain positive, and (d) the Ichimoku Cloud tends to remain green.
CCM / Stockcharts.com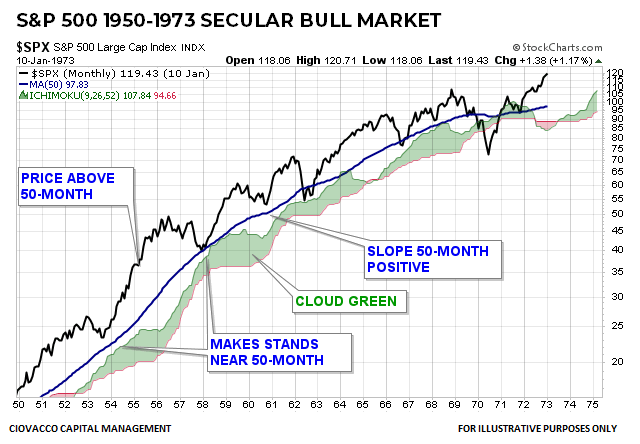
The strongest part of the secular trend above ends in 1968; the moves between 1969 and early 1973 are a grey area (somewhat associated with the end of the secular bull and somewhat associated with the beginning of secular stagnation). During secular bull markets a growth-oriented allocation, a higher tolerance for volatility and drawdowns, coupled with a longer-term strategic focus tend to produce satisfying outcomes.
Secular Stagnation 1969-1979
The same basic characteristics that were present in the 1925-1949 period of secular stagnation were present in the highly indecisive 1969-1979 window. In periods of secular stagnation, a more defensive investment allocation, along with tactical shifts tend to be more effective.
CCM / Stockcharts.com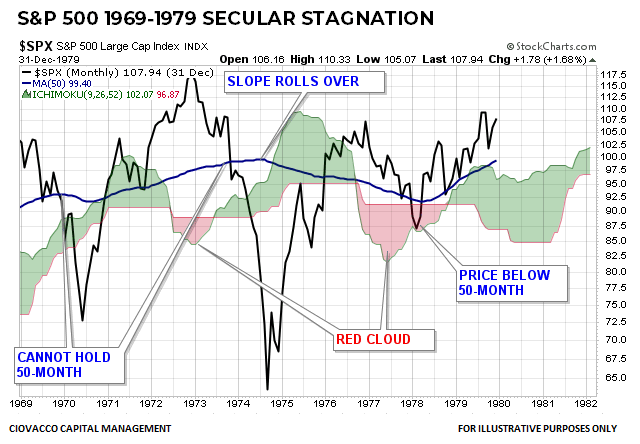
Secular Bull Market 1982-2000
The 1979-1981 window is in the grey area (end of stagnation/beginning of secular bull). The Baby Boomer secular bull market began in 1982 and did not end until March 2000. The look of the chart below could be placed in the “secular bull market” closet in the central casting building. The 1950-1968 secular bull and the 1982-2000 secular bull look very similar and look significantly different from the 1925-1949 and 1969-1979 secular stagnation periods.
CCM / Stockcharts.com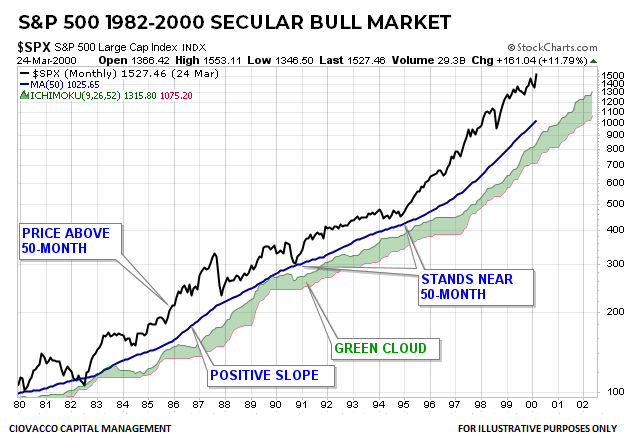
2000-2012 Secular Stagnation
The 2000-2012 period looks a lot like the other periods of secular stagnation (1925-1949, 1969-1979), and looks nothing like the secular bull markets (1950-1968, 1982-2000).
CCM / Stockcharts.com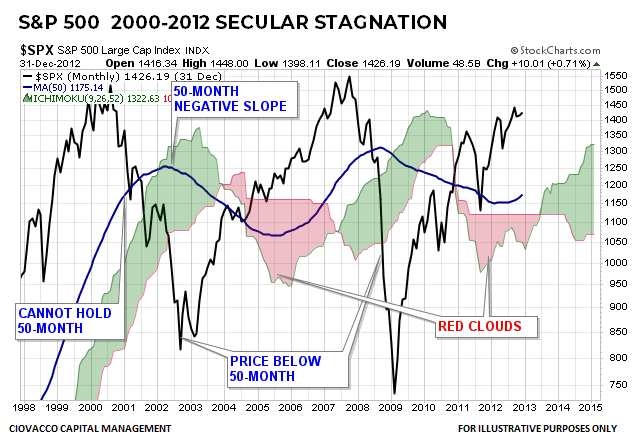
How Does 2023 Compare?
In 2023, it is helpful to review market action from the end of 2012 to see what we can learn about long-term odds for the S&P 500 and S&P 500 SPDR ETF (NYSEARCA:SPY). If you are willing to review all of the historical cases above and objectively compare the 2013-2020 chart below, it is easy to see it shares very little with the secular periods of stagnation and has all the common characteristics of a secular bull market.
CCM / Stockcharts.com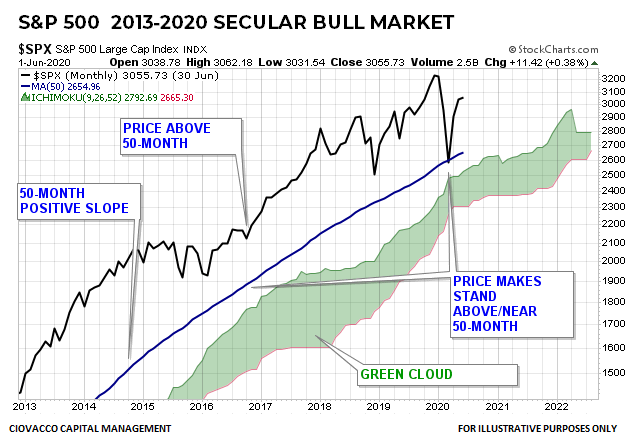
2022-2023: Secular Trend Script
As shown below, the S&P 500 did exactly what you would expect during a secular trend in 2020 and again in October 2022 by making a stand near an upward-sloping 50-month moving average.
CCM / Stockcharts.com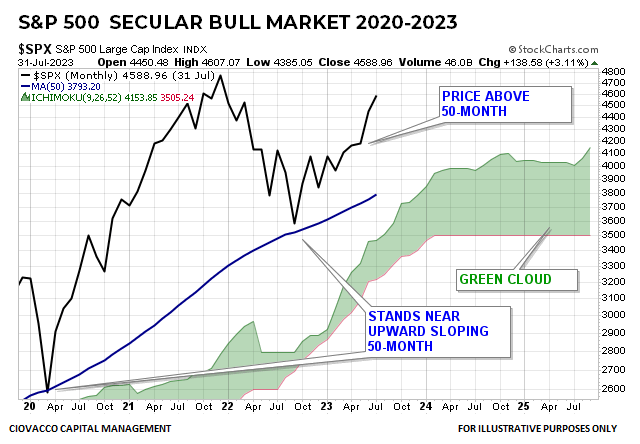
None of the key characteristics of a secular period of stagnation apply to the two previous charts (2013-2020, 2020-2023):
Secular bear markets or long-term periods of economic and market stagnation share numerous characteristics: (a) the S&P 500 typically cannot make a stand at the blue 50-month moving average, (b) price tends to oscillate above and below the 50-month, (c) the slope of the 50-month is often negative, (d) price spends a considerable amount of time below a downward sloping 50-month, and (e) the Ichimoku Cloud typically turns red.
Demographics and A.I.
A weight of the evidence approach looks at questions from numerous relevant perspectives. Thus, after performing a comprehensive analysis of Boomer, Millennial, and Generation Z demographics, which supported the case for a secular bull market that could last until 2034, it is logical to ask:
Do the charts and concepts presented above align with or contradict the secular bull market thesis?
How Is All This Helpful?
As long as the weight of the evidence continues to support a series of higher highs and higher lows in the context of a secular bull market, investors can lean toward growth-oriented investment allocations and prudently try to ignore 100% normal and to be expected volatility and givebacks that occur even in the context of the strongest bullish trends.
CCM / Stockcharts.com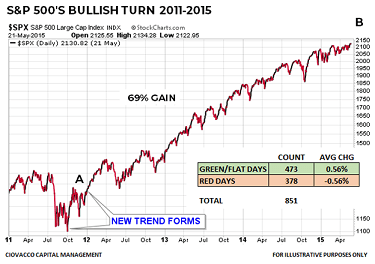
Since markets and stocks tend to be highly correlated, the S&P 500 analysis presented above speaks to the long-term odds for numerous stock-based ETFs, above and beyond SPY, including the NASDAQ 100 (QQQ), S&P Technology Sector SPDR (XLK), and S&P 500 Equal-Weight (RSP). If the evidence shifts in a material manner, we must be willing to reassess the probability of good things happening relative to the probability of bad things happening.
The headlines were negative on Wednesday, August 2, 2023, just as they were on the 378 red trading days that occurred within the context of the 69% S&P 500 move between the end of 2011 and May 2015. The headlines were also negative countless times in the 1950-1968 and 1982-1999 secular trend windows. In each of those historical instances, patient investors were rewarded with higher highs and higher account balances. Given what we know today, any pullback in stocks should be followed by higher highs.
")


 Q4 revenue up 9%, earnings miss")


