Wasan Tita
COTD Bullet Points:
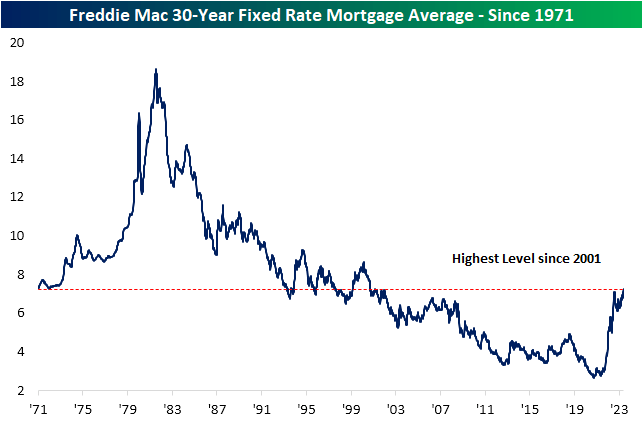
- The national average of a 30-year fixed rate mortgage is at the highest level in over 20 years.
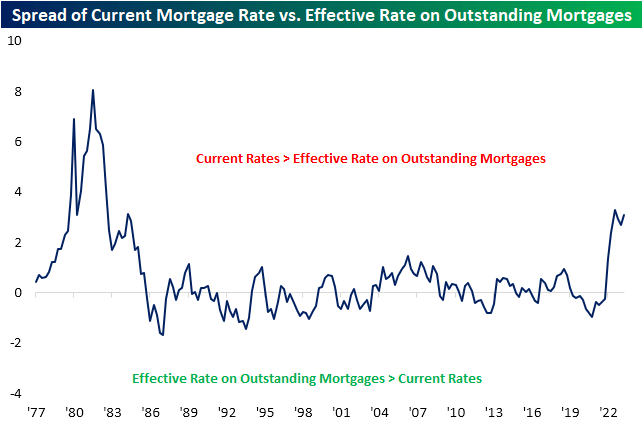
- Rates for new mortgages are especially elevated relative to rates on already outstanding mortgages, and that creates no incentive for existing homeowners to enter the housing market or put their home up for sale.
Chart of the Day:
Last week’s update on the national average of a 30-year fixed rate mortgage continued to rise, coming in at 7.23% which is a level not seen since June 2001.

Earlier this morning, the Bureau of Economic Analysis revised data on the effective mortgage rate on outstanding mortgage debt through the second quarter.
Whereas the aforementioned 7.23% mortgage rate is for anyone looking to enter into a new 30-year mortgage today, this effective rate can be thought of as the average rate being paid by existing borrowers.
While current mortgage rates are higher than any point of the past two decades, they are even more elevated relative to the effective rate on outstanding mortgages.
As shown below, the spread between the current national average and this effective rate on outstanding mortgage debt is slightly off the highs from late last year, however, that spread remains at some of the widest levels since the late 1970s/early 1980s.
Admittedly, the two rates are not perfect comparisons given that outstanding debt likely looks very different (with regards to borrower profiles, terms, etc.) from that of a new 30-year fixed rate mortgage, but the general point is the same: for the bulk of those who already have a mortgage, a new mortgage at current rates would incur significantly higher costs.
That gives them little reason to enter the housing market, and thus, is part of the reason for the dearth in housing inventories.

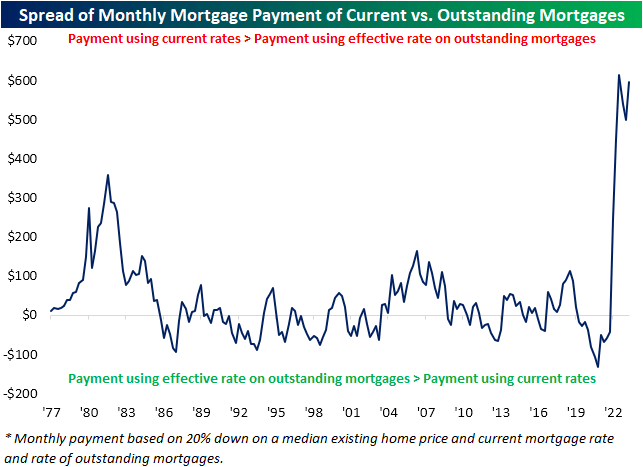
To show another way, below we show the difference in the monthly payment of a median-priced existing home assuming a 20% down payment using the current average 30-year mortgage rate versus the effective rate on all outstanding mortgage debt.
Again, this is an oversimplified analysis given the varying nature, structure, and terms of outstanding debt. Additionally, the payment using the effective rate is not to be confused for the actual observed amount existing borrowers are paying per month (which is lower due to less principal remaining on existing mortgages).
Rather, it is simply the monthly payment calculated by using the effective rate on all outstanding mortgages and applying it to a new mortgage based on the current median price of an existing home.
Based on this approach, the spread is even more blown out and has far surpassed readings from the late 1970s/early 1980s, and the incentive for an existing home/mortgage owner to move looks even worse.
Based on the current median price of an existing home and the current average 30-year fixed mortgage rate, the typical payment comes up to a little over $2,000 per month.
Substituting that current 30-year rate with the effective rate on outstanding mortgage debt, the payment would be much lower at just $1,421 per month!

Since homeowners have little reason to drop would be low payments and re-enter the market, there is not much reason to believe that existing homes will hit the market in any meaningful way soon without a drop in mortgage rates.
That makes new homes an increasingly important share of supply; a good environment for homebuilders. Homebuilder stocks – proxied by the iShares US Home Construction ETF (ITB) – in response continues to sit in an undisturbed uptrend.
This month did see iShares Home Construction ETF (ITB) fall sharply and test that uptrend as it dropped back below its 50 DMA, which formerly was offering a consistent level of support. But, that was short-lived as ITB is fighting to push back above its 50-DMA today.
Original Post
Editor’s Note: The summary bullets for this article were chosen by Seeking Alpha editors.

