

Yoshiyoshi Hirokawa
Investment Summary
There remains no change to the hold thesis on Cerus Corporation (NASDAQ:CERS) following the last two months of price evolution. In my previous analysis on CERS, I argued there was near-term technical support behind the stock, and that price action looked to tilt back to the upside from the July lows.
This hasn’t happened, however – in fact, the opposite has – and now the investment case has weakened substantially in my estimation. Here, I’ve summarized the key fundamental and technical hurdles CERS must overcome in order to justify its inclusion into equity portfolios looking ahead. Net-net, I continue to rate CERS a hold.
Numbers, not narrative: [1]. Rates
The market has pivoted hard from the “possibilities” offered to investors by companies promising cash flows way out into the future. Instead, the probabilities of weaker growth is more than likely. Most notably, the value of these future cash flows is significantly diminished with the rally in long-duration UST yields. Yields at the long-end of the curve have caught a strong bid in FY22 amid the worst YTD selloff in bonds on record. As seen in Exhibit 1, yield distribution has been a key headwind to the growth factor this year [UST 10-yr yield shown by the yellow line below, inverted to display the correlation effect]. As such, it has been a primal driver for losses in the CERS share price as well.
Given the tight dispersion between the S&P 500 growth index [purple line] and the company’s share price, the pair have high autocorrelation, such that CERS’ returns from the FY20–FY21 period are largely beta related. With no real certainty on the path of rates beyond FY22, and the clamping impact to growth, this remains a key systemic risk for holding CERS that cannot be diversified away. Hence, it remains a rates driven story for the CERS share price as it does for the entire spectrum of unprofitable medtech. Investors have stopped rewarding top-line growth and have shifted to rewarding bottom-line fundamentals instead as a consequence.
Moreover, catalysts that I mentioned in the previous CERS analysis have yet to show any inflection on the charts, giving me the impression that investors might have already factored in the bulk of the fundamental upside in CERS case.
Exhibit 1. The covariance structure between UST 10-yr yields [yellow, inverted for visual effect], growth as a factor and the CERS share price is driving equity returns lower
- There remains lack of certainty on the path of rates looking ahead.
- The drifting yields compress the value of CERS’ cash flows that are priced out into the future, thus contracting valuations.
Data: HB Insights, Refinitiv Eikon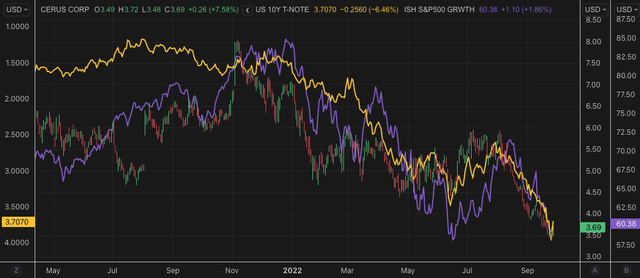
[2]. CERS Earnings Momentum
With the impeding systemic risks covered the debate then turns to CERS’ earnings quality and the return it generates on its investments. These are two critical sets of numbers to ascertain in order to understand a company’s true corporate value, and just what we are buying into if the numbers stack up. In that vein, analysis of the company’s most recent numbers illustrate why the market’s disposed of the company’s market value this year, in my estimate.
Q2 FY22 product revenue came in with a 30% growth schedule YoY posting $41 million (“mm”) at the top-line. Revenue upside was driven by strength in the platelet segment, where North American sales recognized a 75% YoY gain. Its largest 5 customers increased 70% YoY to help propel this result. The US and Canada is a key market for CERS and recent clarification around the ability of Mexican nationals to cross the US border to donate plasma is a factor to pay close attention to in this segment. Segmentally, Intercept kits made up 96% of turnover in Q2 FY22.
The growth in U.S. sales is good news for the company, as a significant portion of its product revenue is still expected to be derived from European based customers. The EUR/USD weakness is therefore a key risk for the company’s bottom line looking ahead. Intercept disposable kits continue to be the main revenue driver for CERS to date, and the company has recognized reasonable return on cost for this segment in the 12 months to date, as seen in Exhibit 2. It sold 2 million units over the TTM, generating $147.84mm in doing so. It therefore shows that CERS generated a 97.4% return on its cost on revenue expenditure required to generate this turnover.
Exhibit 2. Intercept turnover generating 97% return on cost for 12 months to Q2 FY22
Note: All figures in $mm or $000′ except where [%]. Return calculated as NeuroStar revenue per system divided by Q2 COR per kit. (Data: HB Insights, CERS 10-Q Q2 FY2022)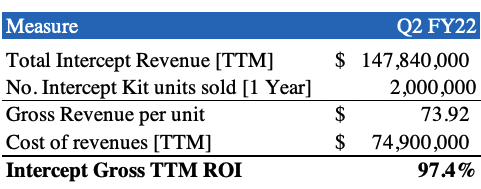
Moving down the P&L, CERS came in with gross margin of 51.9% and decompressed by ~60bps YoY. It printed gross profit of $21.3mm and this was carried down to operating expenditure (“OpEx”) of $34.78mm, a decrease of c$2.1mm, attributed to lower stock based compensation. The change in OpEx also stemmed from a c.$2mm YoY reduction in R&D expenditure.
Technical studies illustrate weakness
CERS’ price evolution since my last analysis exemplifies the kind of challenges it faces looking ahead. As seen in Exhibit 2, I had originally traced the fibs down from the November FY21′ highs to the lows of June/July. At that point the stock had already retraced ~38% of the downside move and was had tested resistance at the ~$5.70 mark on 2–3 occasions.
From there I hoped there would be a breakout to the upside with shares punching through this mark to retrace at least 50% of the down-leg and reach $6.21. This didn’t eventuate, however. The breakdown at the long-end and corresponding fracture to growth in July/August proved too much for buyers and momentum and on-balance volume both fell right off to signify this.
Exhibit 2. Prices had tested the $5.50–$5.70 mark on numerous occasions from January–August.
- This proved to be too heavy of resistance.
- The corresponding shift in UST yields pushed an impulse to equities, fracturing growth and the CERS share price.
Data: HB Insights, Refinitiv Eikon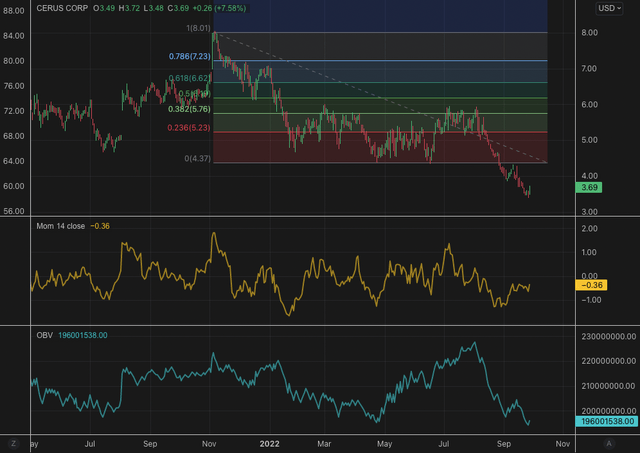
The breakdown is further exemplified on the chart below, where the clear breakout to the downside is seen in the white circle. Before this shares had held range and this resulted in a long period of volatility in range. The down-leg now extends CERS to 52-week closing lows and it now must rally 122% in order to reverse the drawdown from its 52-week high. The question really becomes whether investors will throw CERS a bid to this level or not, and if so, what it would be to drive this kind of upside.
Exhibit 3. CERS price distribution breaking range to the downside. Shares must now return 122% to recover back to 52-week high
Data: Refinitiv Eikon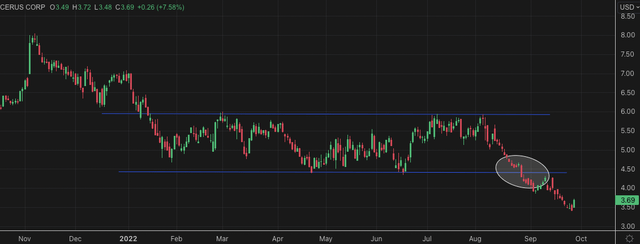
Valuation and conclusion
Question is, what can CERS offer us as investors today in order to start this process. Shares trade at a pricey 7.7x book value and are priced at 4.1x sales and each of these are well above the GICS peer median. At the consensus FY22 revenue estimate of $186mm, 4.1x sales values CERS at $4.30, little upside from the current market price.
Meanwhile, the lack of earnings and return on capital are factors that make understanding CERS’ corporate value inherently difficult. Coupled with an increasing discount rate that reduces the probability, predictability and value of future cash flows, this is also to be taken into consideration. A negative return on equity and earnings yield suggest there’s better opportunities elsewhere. Plus, with the share price diverging from CERS’ top-line fundamentals anyway [Exhibit 4] there’s little chance for a reversal unless the company comes in with an above-consensus revenue result. Net-net, I continue to see a lack of compelling value in CERS and retain the hold rating on the stock.
Exhibit 4. Divergence of share price to top-line fundamentals – raises questions on what the CERS share price has to cling onto.
Data: Refinitiv Eikon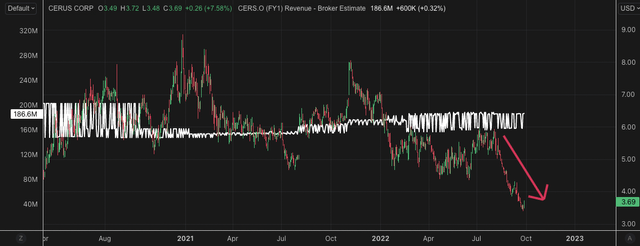
")


