Eugene Gologursky
We have covered Brookfield Property Partners several times while it traded as a public entity. In our article discussing the takeover, we pointed out to disgruntled shareholders, that they were getting an awesome deal to be taken private by Brookfield Asset Management Ltd. (BAM). This was despite the apparent “discount to NAV” that made investors feel that they were robbed. As BPY exited the public eye, three preferred issues were left on the NASDAQ.
1) Brookfield Property Partners L.P. 6.50 PF UNIT (NASDAQ:BPYPP)
2) Brookfield Property Partners L.P. 6.50 PF UNIT (NASDAQ:BPYPO)
3) Brookfield Property Partners L.P. 5.75 CL A (NASDAQ:BPYPN).
There are several more listed on the TSX. For the purpose of this article we will be dealing with them collectively. As there are subtle differences and pricing advantages and disadvantages, the fundamentals we will be discussing will apply broadly to all of them.
The Fundamentals
In the most recently released annual report, BPY had almost the same funds from operations (FFO) as that in the previous year.

BPY Annual Report
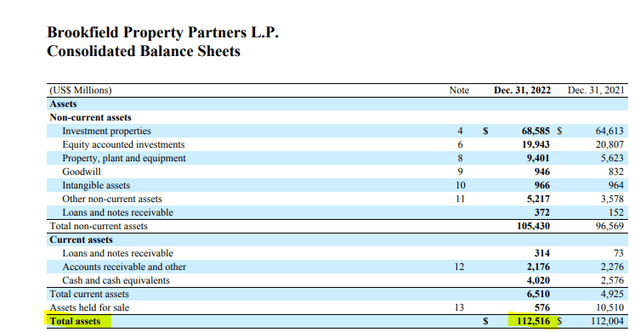
Let’s keep in mind that number of $586 million as we assess that BPY managed to generate that using over $112.5 billion of total assets.
BPY Annual Report
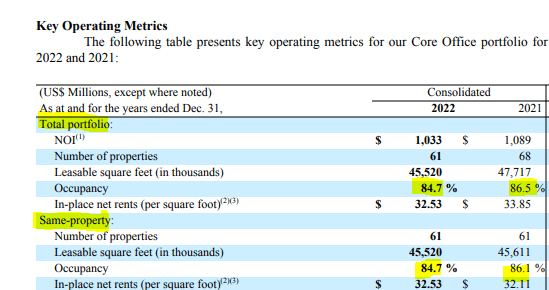
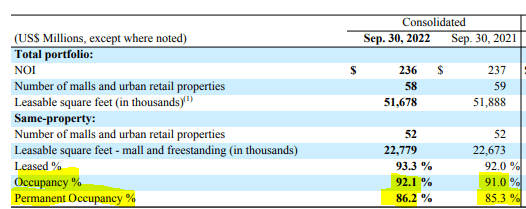
So there is a lot of leverage here with $112.5 billion of assets and over $70 billion of total liabilities (note that this is different than total debt), to get to our FFO of $586 million. Interestingly, there is a big deterioration in the FFO of the core office segment. The key culprit is their office occupancy. You can see the drop below.
BPY Annual Report
Also do note that the number of properties has dropped. This has happened as BPY defaulted on some mortgages and sold a few properties.
BPY Annual Report
BPY was able to maintain its FFO year over year through the LP segment, which tends to rely on development and asset sales for its cash flow. While that has done ok for now, we think 2023 and 2024 will challenge this segment to deliver.
Debt
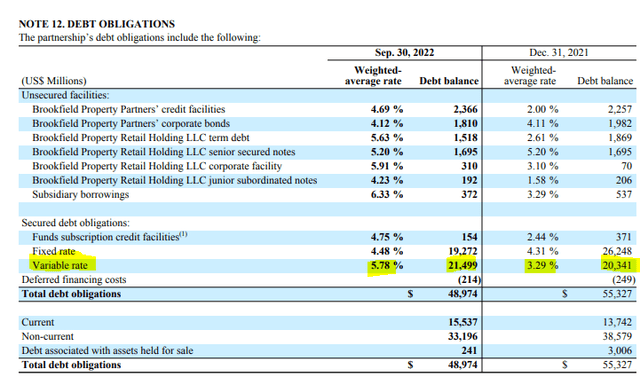
With the massive liabilities that BPY has, interest expenses must be watched. Note here that we are showing you Q3-2022 numbers first to make our point.
BPY Annual Report
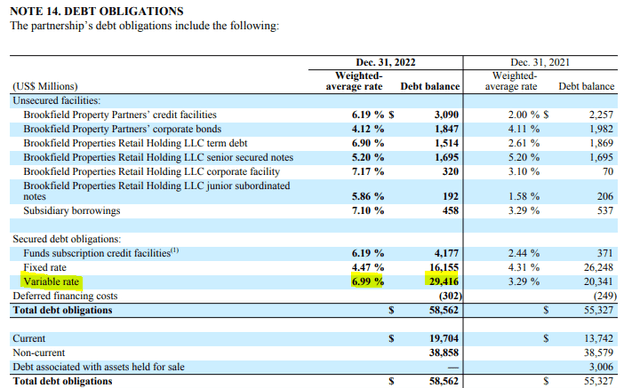
You can observe the change in variable rate financing where interest rates were 5.78% versus 3.29% in Q3-2022. Getting to Q4-2022, we were at 6.99% on that same area. Notable here is that BPY has borrowed an additional $8 billion on this form of financing.
BPY Annual Report
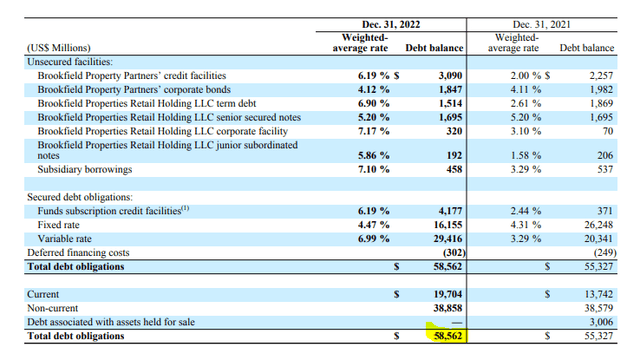
BPY also has $41 billion of debt to be refinanced within two years.

BPY Annual Report
These are massive numbers in relation to its FFO. Currently the FFO is dwarfed by the interest expense.

BPY Annual Report
So the total (FFO + interest expense) is $3,269 million, out of which interest uses up $2,683 million. We believe that interest expense will be up substantially in 2023 and 2024 and we could eat up all of the FFO, especially if we hit a recession. We will add here that capex is downstream of FFO and not even counted in that calculation.

BPY Annual Report
Comparatives
The key reason investors are chasing these preferreds are the yields. The three NASDAQ listed preferreds yield about 8.75%, a rare treat in the preferred world today. While they do stand out, one must evaluate them in light of where markets are. Current short-term interest rates are expected to peak near 5.6%. So while the yield is high, it is less appealing compared to a time when risk free rates were 0%.
There are similar issues which are beholden to the same office property risks that yield a similar amount. Hudson Pacific Properties, Inc. 4.750% CUM PFD C (HPP.PC) which we have covered previously, gives you a similar bang for your buck. One notable fact here is that Hudson Pacific Properties’ (HPP) debt to EBITDA is less than half that of BPY (calculation coming further down).
Yet another way to see how much extra you are getting for that extreme leverage risk, is to run the numbers against other Brookfield companies. Brookfield Infrastructure Partners L.P. 5.125 (BIP.PA) yields slightly over 7% and as we discussed (see, Brookfield Preferred Shares Offer Safe Quality Yields), is exceptionally safe.
So the yield is relatively modest in relation to the risks of owning these..
Verdict
BPY continues to remove cash out of the partnership, at a rate that exceeds their own declared FFO and operating cash flow.
For the years ended December 31, 2022, 2021 and 2020, the partnership made distributions to unitholders of $1,169 million, $878 million and $1,244 million, respectively. This compares to cash (outflows) inflows from operating activities of $(53) million, $606 million and $1,332 million, respectively, for each of the three years then ended. In 2022 and 2021, distributions exceeded cash flow from operating activities.
Source: BPY Annual Report
The current asset valuations are done with cap rates that we believe are completely unrealistic.

BPY Annual Report
As we get further into 2023, we will likely see a further widening of cap rates, whether or not we see it on BPY’s reports.
BPY does not show an EBITDA number, but the FFO + interest expense number shown above ($3,269 million) is a good proxy. A more generous proxy is the total net operating income.

BPY Annual Report
It is more generous as general and administrative expenses are added back here (unlike in an EBITDA definition). Whichever one you use, weigh that against the debt load.
BPY Annual Report
Anyone want to run a debt to “EBITDA” on that?
So for us this is a no-go. Sure investors argue that the preferred dividends are cumulative and unlikely to be cut. But when your leverage is this high, both tend to go together. We heard the same arguments as to why CorEnergy Infrastructure Trust, Inc preferred distributions (CORR.PA) would hold up, and when the common was cut, the preferred went flying out at the same time. So for us this is one where the risks are not worth it. Sure you can sit back and collect one or maybe even three years of distributions.
But that to us is just a cumulative 5% extra over three years versus holding BIP.PA.
Would we want to risk a near wipe-out for that little extra? Would we buy any company with a 16X debt to EBITDA for that little extra? Would we buy any company with a 16X debt to EBITDA when 62% of the debt is floating rate for that little extra?
Approximately 62% of our outstanding debt obligations at December 31, 2022 are floating rate debt compared to 48% at December 31, 2021. This debt is subject to fluctuations in interest rates. A 100 basis point increase in interest rates relating to our corporate and commercial floating rate debt obligations would result in an increase in annual interest expense of approximately $367 million
Source: BPY Annual Report
No way. The only reason this is even being debated here is because of the Brookfield Corporation (BN) and BAM names attached to this. So sure, if that is your core logic, there is not much we can do about it. For our part, we would choose the safer quality yields presented by other Brookfield names and sleep well at night.
Please note that this is not financial advice. It may seem like it, sound like it, but surprisingly, it is not. Investors are expected to do their own due diligence and consult with a professional who knows their objectives and constraints.
Editor’s Note: This article covers one or more microcap stocks. Please be aware of the risks associated with these stocks.


