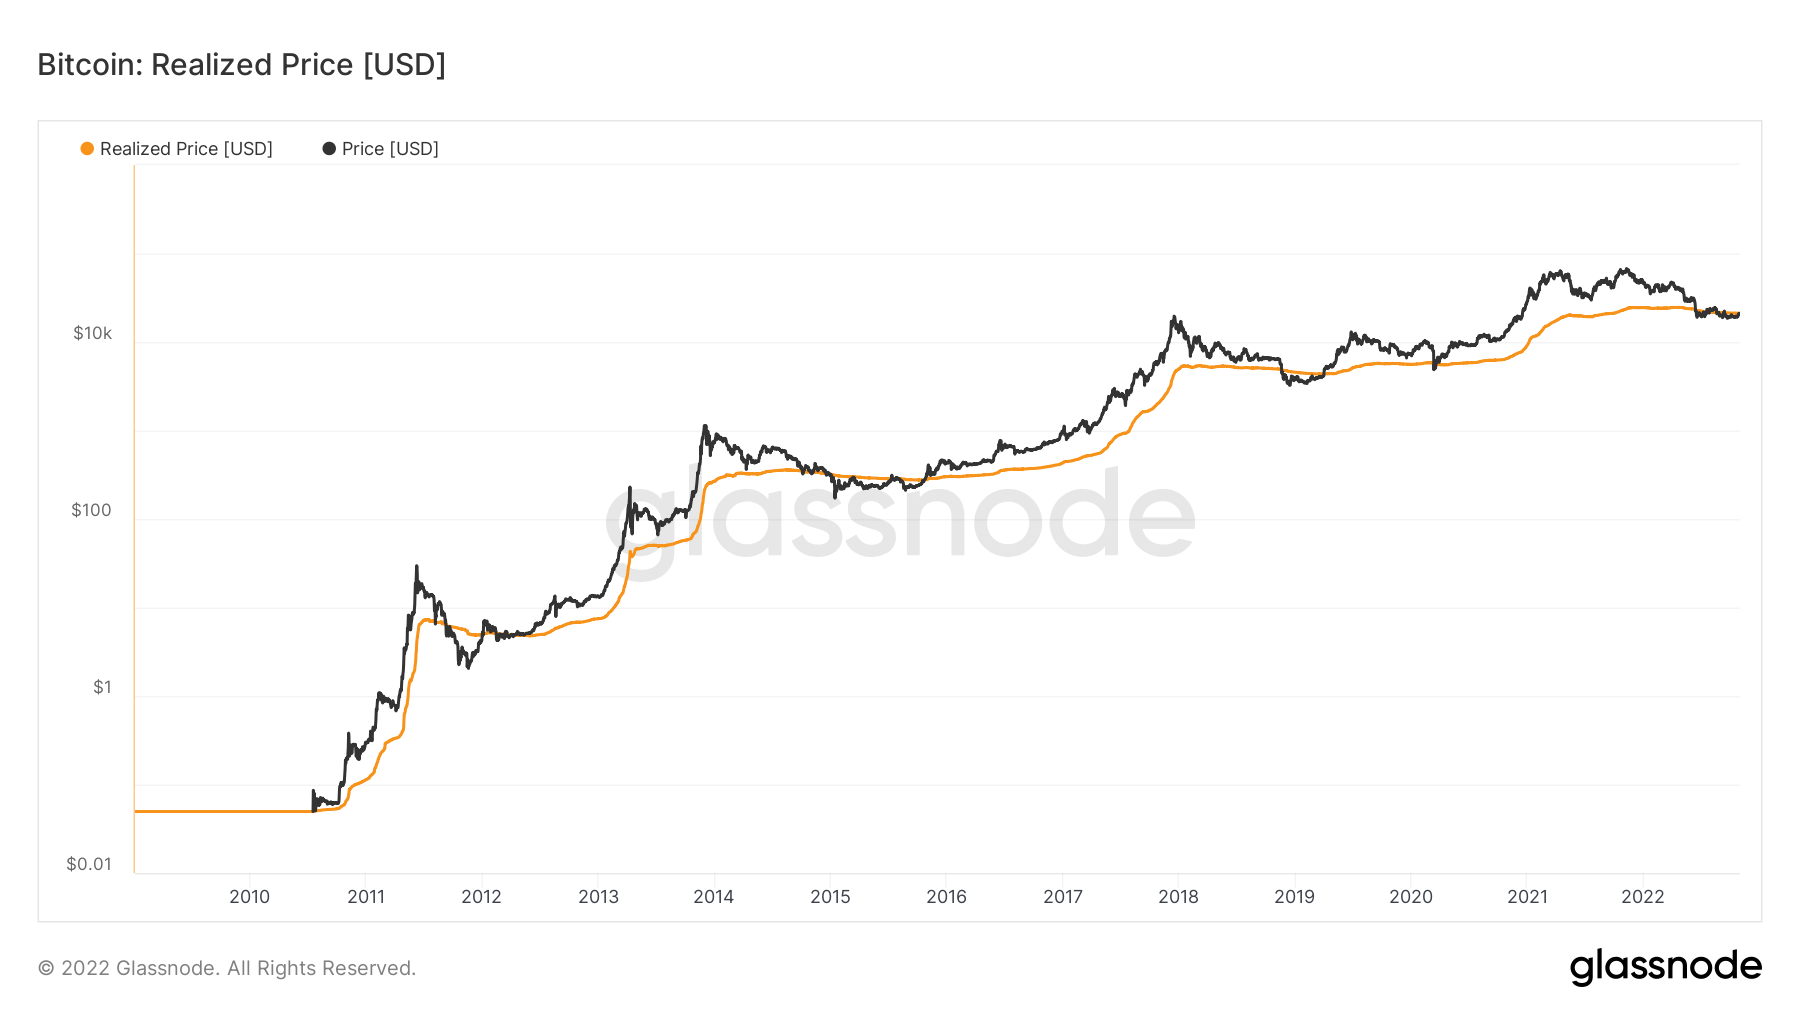
CryptoSlate’s analysis of Bitcoin’s (BTC) realized price and cost basis cohorts revealed that the transition from the current bear market could potentially transition to a bull market by the end of the first quarter of 2023.
Realized Price
The realized price is calculated by dividing Realized Cap by the current supply.
The realized cap metric is slightly different than the market cap. While the market cap uses the current price of an asset, the realized cap uses the price at the time it last moved. It considers different parts of the supplies at different prices instead of taking the daily closing price.
Specifically, it is computed by valuing each unspent transaction output (UTXO) based on the price when it last moved.

When Bitcoin’s real price fell below $20,000, it also fell below the realized price and has been battling to overcome it. At the time of writing, Bitcoin is trading around $20,430, which brings the realized price just above $21,000.
Cost Basis Cohorts
The realized price reflected the aggregate price when each coin was last spent on-chain. Therefore, the realized price for short-term holders (STH) and long-term holders’ (LTH) cohorts can be calculated to reflect the aggregate cost basis for both groups.
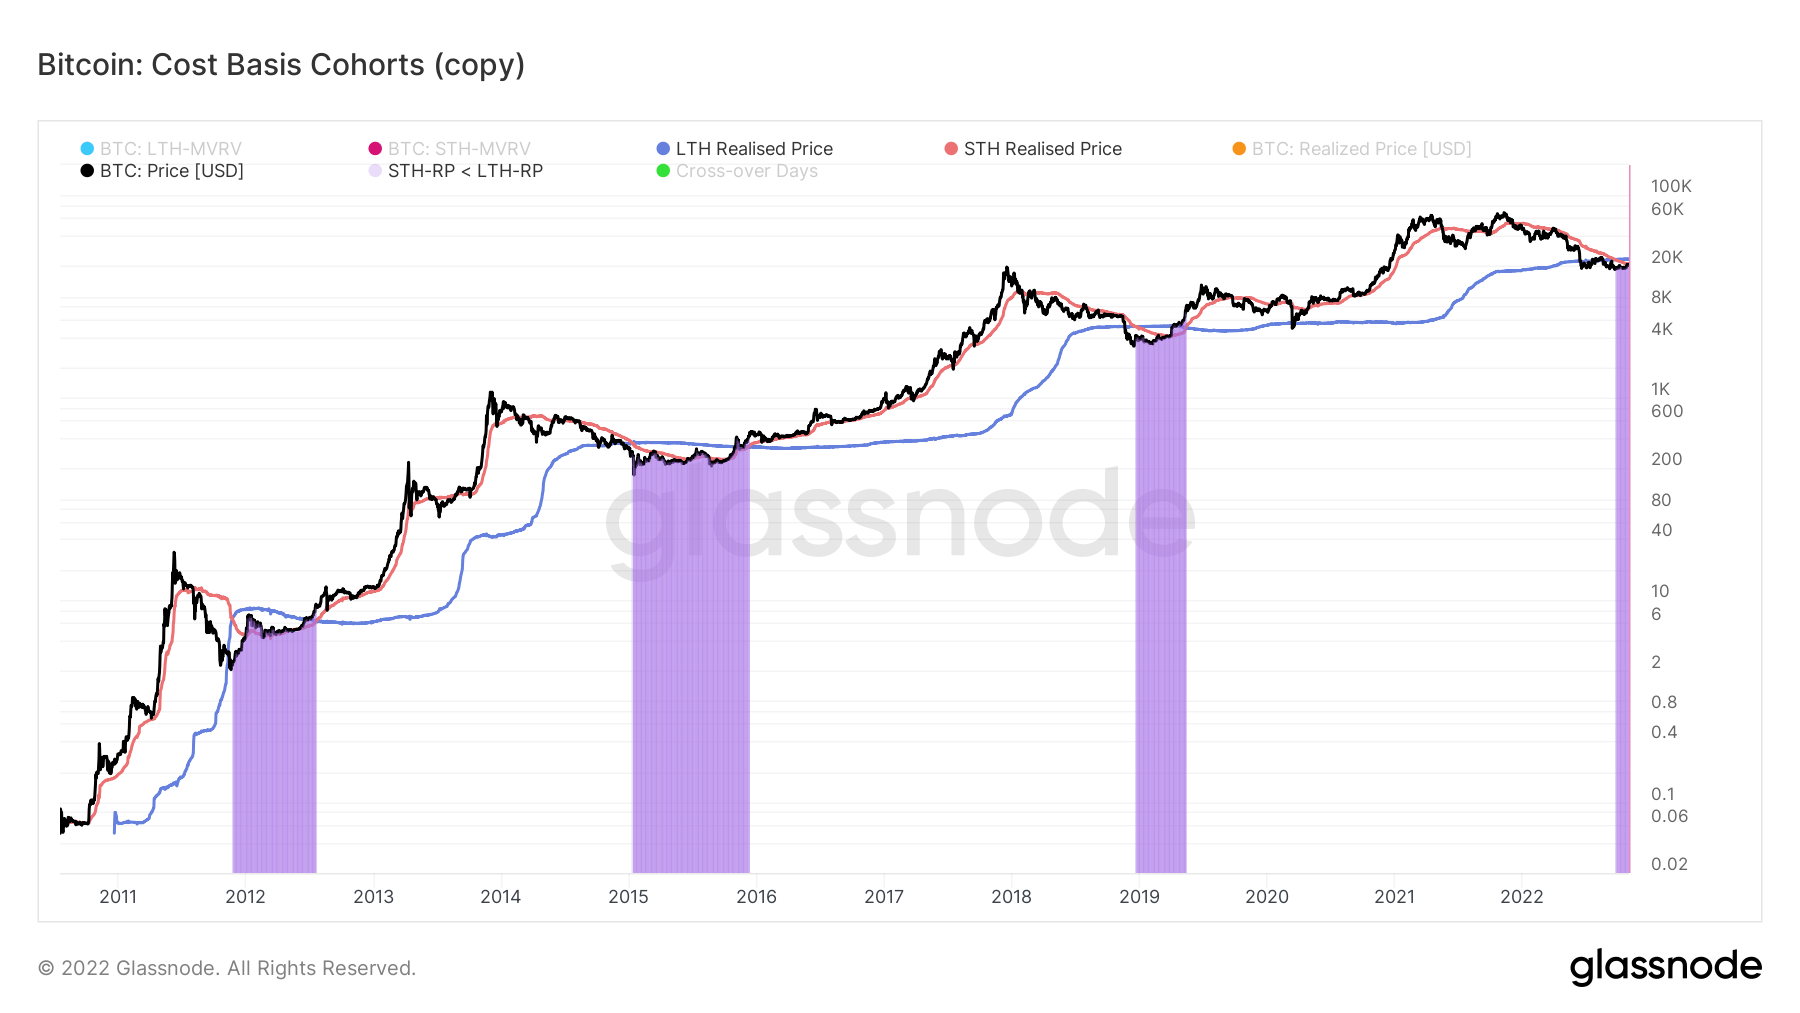
When calculated, LTH and STH cost basis ratios reflect the ratio between the realized price of LTH and STH. If this metric appears as an uptrend, it indicates a bear market setting where the STHs are losing at a greater rate in comparison to LTHs. If it draws a downtrend line, it reflects a bull market sentiment where LTHs spend their holdings and transfer them to STHs.
The cost basis ratio reflects trade to be greater than 1.0 when the LTH cost basis point is higher than STH. This metric has previously signaled that the market has reached the final stage of bear market capitulations.
Bitcoin’s cost basis cohorts chart shows that the current price has fallen below the STH and LTH realized prices on Sept. 23 and remains below them as of Nov. 3.

Such a signal has only occurred three times before — reflected in the chart below with the purple areas.
In each incident, Bitcoin price surged to new all-time-high (ATH) levels.
Bitcoin price looks like it will break its current resistance ranging from six months to a year — with the most optimistic analysis putting it at the end of the first quarter of 2023.


