champc
Written by Nick Ackerman, co-produced by Stanford Chemist.
BlackRock Enhanced Equity Dividend Fund (NYSE:BDJ) hasn’t moved too much since our last update near the end of December. The fund has provided some positive returns, but the discount has remained basically static during this time. That means it’s still trading near historically wide levels, and that makes it an attractive level, in my opinion. Of course, the longer this discount remains around this level – the more “normal” this discount will become.
BDJ Performance Since Prior Update (Seeking Alpha)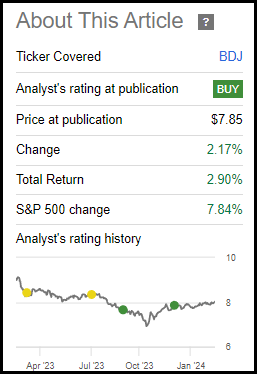
The fund utilizes a covered call strategy on a portion of its portfolio. That’s not the only thing that sets this fund apart from the “broader markets,” though. This fund benchmarks the Russell 1000 Value Index and also includes the MSCI USA Value Call Overwrite Index. The broader market these days has become mostly the mega-cap names that have dominated the major indexes. Those names have become so dominant because their performance has been incredible, and value-oriented performances have not been so incredible.
That said, I have plenty of exposure to those mega-cap tech names through other funds. I find BDJ appealing because of its differentiated approach and the strong and steady monthly distribution that it is able to provide. Since our last update, the fund has also posted its latest annual report. That gives us some new figures to look at on that front, as well as potential portfolio changes to discuss since that prior update.
BDJ Basics
- 1-Year Z-score: -0.74
- Discount: -10.59%
- Distribution Yield: 8.41%
- Expense Ratio: 0.86%
- Leverage: N/A
- Managed Assets: $1.67 billion
- Structure: Perpetual
BDJ’s primary objective is to “provide current income and current gains.” The fund intends to achieve this by “investing in common stocks that pay dividends and have the potential for capital appreciation.” They concentrate on dividend-paying stocks with “80% of its total assets in dividend-paying equities.”
The fund will also employ a covered call strategy on single stocks. Their latest update doesn’t actually reflect how much the portfolio is overwritten at this time. It seems as though this was potentially an oversight, as their last annual report most definitely had outstanding options written.
BDJ Options Stats (BlackRock)
In our prior update, it was near ~50%. That’s being on the aggressive side, considering the 30 to 40% overwrite target they generally have. This has been around the same level for a while now, as we’ve been doing updates on BDJ over the last year. This puts them in a more defensive tilt overall, as it brings in more options premiums for the fund. However, as naturally is the case with a covered call fund, it also can cap upside potential.
Performance – Discount Remains Wide, Remains Attractive
Along with the fund’s latest annual report, we get a breakdown of how the fund has been performing against its benchmarks. The total NAV returns have been fairly competitive with the Russell 1000 Value Index. Against the overwrite index, BDJ has been performing materially better.
BDJ Annualized Performance Compared To Index (BlackRock)
This has been consistently the case and is likely to continue, given the fact that covered call funds will generally lag their non-writing index benchmarks and peers. This can happen because, over time, returns tend to trend higher, and that eventually leads to some upside potential being capped on some of the names they write against. They can close out a contract to avoid getting a stock called away; however, that itself comes with a cost that would see the reduced performance on a relative basis.
On the other hand, we can see that the fund’s total market price has been slipping quite materially and diverging from the total NAV returns. This is an important characteristic of closed-end funds where these divergences play out. This is because that means the fund is either seeing its premium reduced and going into discount territory, or it is in discount territory already, and the discount is getting wider. This often creates a situation where there is a buying opportunity, as performance going forward could be stronger from discount contraction.
It can also create a situation where the downside potential of the fund from further discount widening can be more contained as well. During times of higher volatility, discounts can widen on CEFs. So, if they are already at a meaningful discount, the widening impact from that could be relatively reduced.
For BDJ, the last 1 year’s z-score doesn’t necessarily show the deepest discount. This is because the fund has been trading at around this discount level for most of this period now. Prior to that, the fund did sport a bit of a premium and that made the latest fall in the last year that much more dramatic.
Over the long term, the latest discount is looking relatively attractive as it’s toward the lower end of its historical range. The main outlier here would be during the Covid crash, which saw the discount exceed 20%.
Ycharts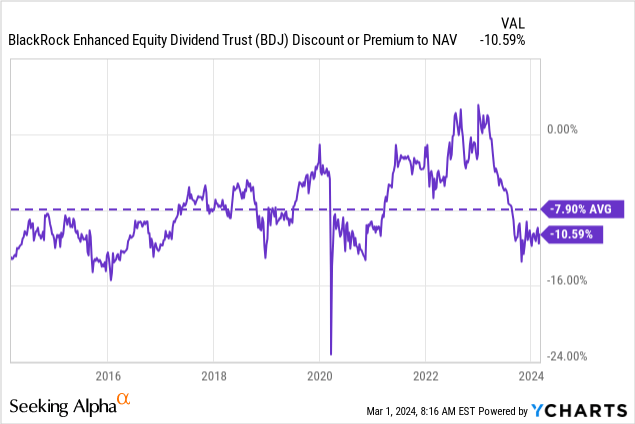
Distribution – Attractive And Steady
Another appealing feature of BDJ is the fund’s distribution. That said, the fund’s discount actually plays a direct role in making BDJ’s payout even more attractive. This is because the fund’s distribution rate comes to 8.41% on a share price basis. That is, investors buying in today at these levels will receive that amount on a forward basis (assuming no distribution cut.) However, on an NAV basis – what the underlying portfolio has to earn to cover this payout – is 7.52%.
The fund has been paying the latest monthly distribution since early 2022, which, at that time, was an increase from the previous payout. In mid-2019, the fund also saw its distribution increase. Further, there have been a few specials paid out along the way in the last handful of years as well.
BDJ Distribution History (CEFConnect)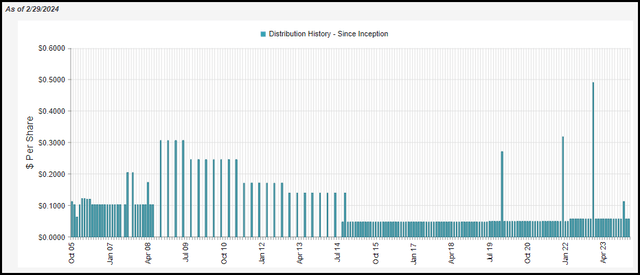
To fund this distribution, the fund will rely on capital gains from the underlying portfolio or its covered call strategy. This is because, like most equity funds, the underlying portfolio doesn’t pay sufficient dividend yields to cover the payouts at the level these funds pay.
For BDJ, the fund saw its net investment income increase year-over-year. That said, the coverage came to around 25.18% against the fund’s total distributions. That includes the $0.055 special that the fund paid last year.
BDJ Annual Report (BlackRock)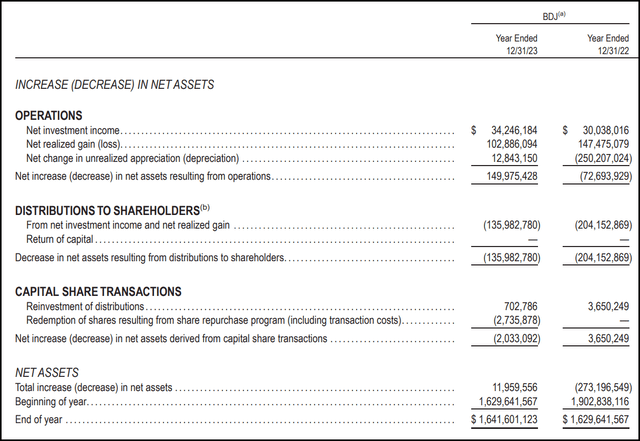
On a per-share basis, the fund’s NII came to $0.18, which provided NII coverage of ~27% against the regular annualized distribution of $0.6744.
We can see, though, that the fund clearly realized enough gains in the fund to cover the distribution. In fact, we can see that despite 2022’s struggles, with the fund seeing significant unrealized losses pile up, they still had meaningful realized gains in the fund, too.
For 2023 specifically, the fund’s gains largely came from the underlying portfolio. The options written through 2023 resulted in the fund realizing losses of nearly $7 million. That goes back to the idea that they can close out these options contracts, but it comes with a cost.
BDJ Realized/Unrealized Gains/Losses (BlackRock (highlights from author))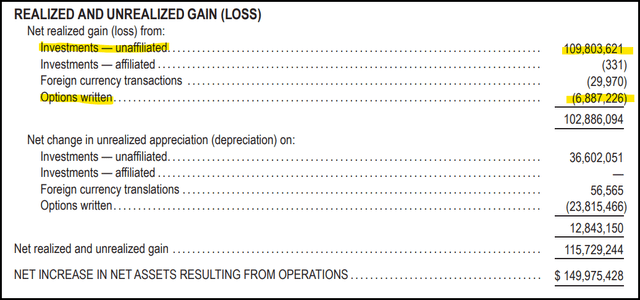
For tax purposes, the fund’s distribution characterizations have largely been similar to the fund’s earnings in terms of income versus capital gains. Given the large-cap focus, there is a portion of the distribution that also qualifies as more tax-friendly qualified dividends.
BlackRock Distribution Tax Classifications (BlackRock (highlights from author))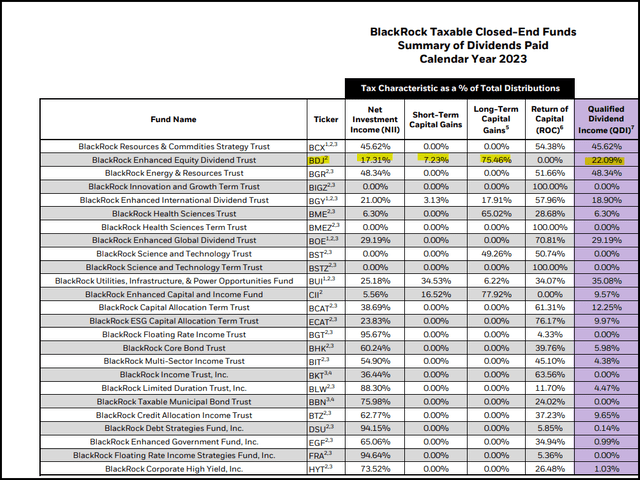
BDJ’s Portfolio
Given BDJ’s benchmark of the Russell 1000 Value Index, we see that the fund’s largest allocation is to the financial and healthcare sectors. Industrials, energy and consumer staples then follow this before we get to information technology. Tech comes in at a fairly small 7.3% weighting as of the last update.
BDJ Sector Allocation (BlackRock)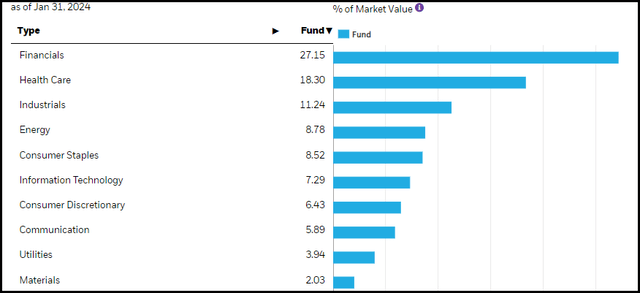
That’s been fairly consistent since our prior update, but if we are getting technical, the fund actually saw an increase in consumer staples weighting. It was enough of a climb that it surpassed the tech sleeve weighting as it came down a bit since the late October 2023 allocation breakdown. Financials also saw a small increase of around 2 percentage points. Healthcare exposure has stayed mostly flat over the last three months.
For a bit of color to compare to the S&P 500 Index, the (SPY) now lists around 30.5% of its portfolio as technology, with ~13% in healthcare and 12.6% in financials.
The fund is heavily invested in large-caps, at around 95% of the fund’s total portfolio. Additionally, the fund is primarily focused on U.S.-based companies, with over 82% of the portfolio allocated there. That means, all combined, the fund could have some meaningful global exposure, but even that is mostly relegated to one specific country, that country being the U.K. at nearly 9%
While the fund’s benchmark might be the Russell 1000 Value Index, BDJ does not invest even remotely close to 1000 companies. Their latest update noted a total of 96 holdings, which is up a bit from the 91 holdings they had listed previously. The top ten holdings comprise a total of 25.76% of the portfolio.
BDJ Top Ten Holdings (BlackRock)
With this latest update, we don’t see too many material changes. Instead, we have some of the normal market gyrations that result in positions flopping positions. That is, Shell (SHEL) is no longer the top holding; it has merely slipped down to the fourth spot. The top holding now belongs to Wells Fargo (WFC), but that was simply only up from the second largest holding that it was listed at previously.
Citigroup (C), American International Group (AIG), Kraft Heinz (KHC), Leidos Holdings (LDOS), First Citizens Bancshares (FCNCA) and L3Harris Technologies (LHX) were all previously top ten names as well.
That makes General Motors (GM) and Fidelity National Information Services (FIS) new additions to this top ten. That saw the replacement of BP (BP) and Cisco Systems (CSCO) as top holdings. However, both CSCO and BP were still listed as holdings at the end of December 31, 2023. Whether they still were at the end of January 31, 2024, or currently still are is indeterminable unless you’re a portfolio manager.
Conclusion
BDJ holds a value-oriented portfolio and writes covered calls on a portion of these underlying holdings. The fund also pays out a monthly distribution that has remained reliable and steady for over a decade now. Given the relatively low NAV rate on the distribution, the payout here seems to be quite safe, given the current environment. The fund also sports a deep discount on an absolute and relative basis, making it an attractive candidate for income investors to consider at this time.


