

franckreporter
Investment Outlook
Blended large-cap equity funds are increasingly attractive now that investors have reignited their risk appetite towards the end of 2023. Those funds with full index replication provide seamless exposure to investors on the strategic side of allocation. These funds are (1) cheap to own, (2) high [and/or smart] beta, thus removing the challenges to security selection, and (3) compound wealth effectively over time. One can own a diversified portfolio of leading securities in a single instrument with such smart-beta funds.
In that vein, investors may want to consider the JPMorgan BetaBuilders U.S. Equity ETF (BATS:BBUS) as part of their strategic equity allocation. Investors can achieve near-full index replication with BBUS, albeit with exceptionally cheap fees and comparable yields. The S&P 500 index is above 4,500, and the SPY (SPY) is at ~$450 per share, whereas BBUS provides a near-perfect correlation to both the SPY and the Vanguard S&P 500 (VOO) (Figure 1) at $81/share at the time of writing.
Figure 1. BBUS (Blue) vs. VOO (Red)+ Equity Beta
Source: Updata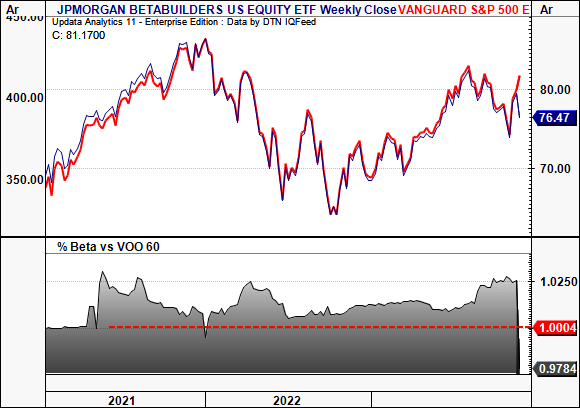
The critical investment facts are as follows:
- BBUS is a blended large-cap equity fund with $2.3Bn AUM and tracks the Morningstar US Target Market Exposure Index, using full replication. According to Morningstar: “The Morningstar US Target Market Exposure Index targets large- and mid-cap U.S. stocks representing the top 85% of the market by float-adjusted market capitalization”. This method allows near perfectly correlated returns to the SPY but at ~18% of the cost ($81/$450).
- The expense fee to own BBUS is just 2 basis points.
- Dividends, paid quarterly, yield 1.4% as I write at a $1.14/share trailing payout.
- Tracking error to the benchmark is 0.57% in 1 year, 0.78% in 3 years. Hence the low expense fee, given full replication and no “value add”.
- Top 10 holdings are 30% of the fund. Sector bias is to technology at 30% of sector weighting, followed by healthcare (12.5%) and financials (12.2%). Highly diversified with 596 holdings.
For those who are bullish on US equities over the long run and have a long-term investment horizon, BBUS is one to consider for strategic allocation. Key advantages are 1) a cheaper entry point to major benchmarks and 2) smaller expense fees. This report will run through my reasoning for buying the fund. Net-net rate buy.
Figure 2.
Data: Updata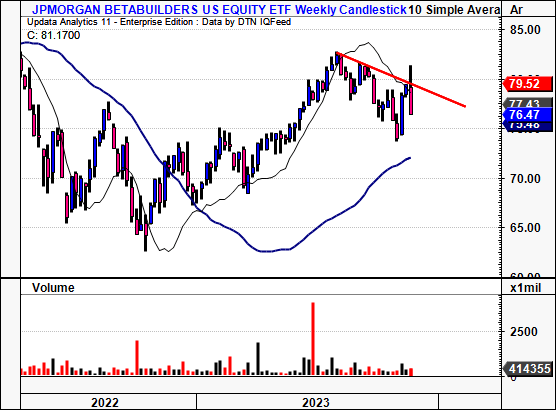
Talking points
Competitive advantage from smart beta + full index replication
The benefit to portfolio construction using BBUS as a strategic alternative to the major indices is on cost and relative value. Cost, as it’s cheaper to own BBUS on a per-share basis. Relative value is due to the amount of equity capital that can be bought on each tranche.
Here, we ran a sample with two equity-linked portfolios for a hypothetical investor who is long US equities, dividend income and real estate. Time was constrained to 2019 when BBUS began offering its securities. Portfolio 1 was an equal weight of VOO, the iShares Core U.S. REIT ETF (USRT) and Vanguard High Dividend Yield ETF (VYM). Portfolio 2 was the same, exchanging VOO for BBUS.
Results, depicted in Figure 3, show:
- No statistical difference between key portfolio measurements,
- Identical risk-adjusted returns (Sharpe and Sortino ratios),
- Near identical final balances without any additional allocations.
The second test, shown in Figure 4, allocated $1,000 monthly after the principal investment from March 31st, 2019, quarterly rebalancing. Critically, the compounding rate of money return was 56% for both the VOO and BBUS portfolios, with matching volatility. The investor would also own 315 shares of BBUS, versus 56 shares of VOO.
This shows that BBUS is a valuable tool to replicate equity returns on the strategic side of asset allocation. It can be used instead of more “expensive” index funds for a level of desired equity exposure.
Figure 3.
Source: Portfoliovisualizer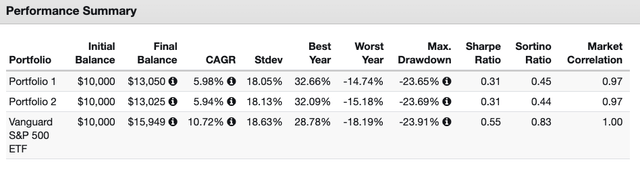
Figure 4.
Source: Portfoliovisualizer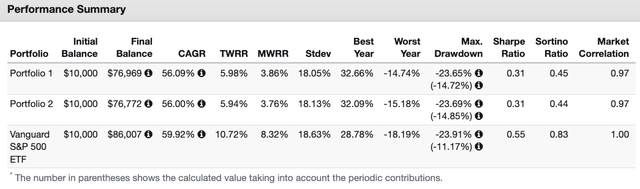
Robust outlook for US growth equities
The case for extended US outperformance is supported by three notions: (1) improved economic outlook, (2) projected earnings growth, (3) potential pause in the Fed’s rates cycle. We have already seen the market price in a more optimistic outlook on earnings + dividend growth over the last 2-3 weeks. These points support a constructive view on US equities.
(1). Improved macro outlook
Economic data supports the motion for a more optimistic outlook on growth. Those at Goldman Sachs have identified 4 compelling arguments for the revised forecasts in US economic activity.
One is that it believes US real income growth will be sufficient to support consumption and GDP growth of at least 2%. The second point is that the worst of tightening policy (including rates and credit tightening) and the reasons for it (inflation and so forth) may be behind us.
The firm also believes manufacturing activity should increase next year from a flat base in 2023. Finally, GS suggests we may not need a recession to bring inflation down. Instead, the Fed may pivot to avoid a recession. This could see a reversal in tightening policy and a potential bullish signal for equity markets.
Figure 5. “Cuts are coming sooner or later [ in EM + DM ]”, according to Goldman Sachs Macro Research.
Source: Goldman Sachs Macro Research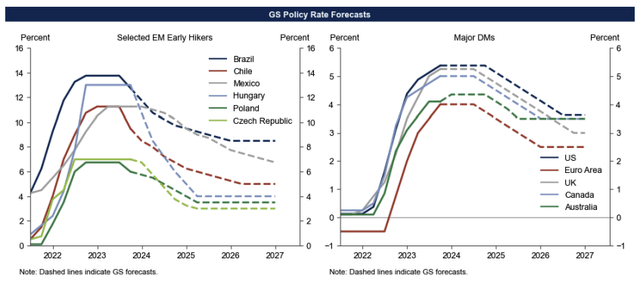
(2). Projected earnings growth
After strong earnings were posted by US majors in Q3, growth projections for 2024 remain skewed to the upside. S&P 500 index companies reported earnings growth of 4-5% in Q3, with 9 of 11 sectors reporting year-on-year upsides. Growth was led by technology and communication services along with financials. This is a positive for BBUS.
Moving forward, Wall Street projects a 100 basis points slow down in Q4 2023 earnings growth to 3.2%, according to FactSet analysis. Critically, this is not set to remain in situ:
- For Q1 2024, analysts are projecting year-on-year earnings growth of 6.7%, stretching this to 10.5% for Q2 2024. Moreover, all sectors are expected to report YoY earnings growth by Q2 next year.
- So, the outlook for large-cap equities remains attractive, and the growth calculus is skewed to the upside. This is highly constructive for stock returns over the coming 1 to 3 years. Equity values are highly sensitive to sales and earnings growth over this duration.
The expected outcomes for S&P 500 index companies and their business growth are a bedrock for BBUS. It has a smaller market capitalisation than other replicated products, providing more distribution of capital, especially for smaller accounts. Therefore, over the coming 1-3 years, I am constructive on the fund.
Figure 6.
Source: FactSet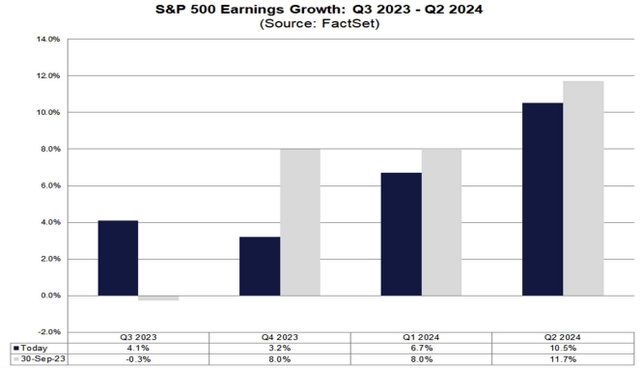
(3). Potential pause in hiking cycle
Two major events have lightened the tone of US equity performance compared to 12 months ago.
One, a revised US GDP outlook for 2024 has the market pricing in a period of better business over the next 1 to 2 years.
Two, the Federal Reserve’s decision to put the handbrake on its rates hiking cycle at its November FOMC meeting was a critical junction for risk assets.
In particular, it signalled a potential turning point in the valuations of high-quality investment securities. The question is, have central banks actually put a firm stop to hiking policy rates and tightening the noose on financial conditions?
- The crowd at Goldman Sachs believes that most developed markets’ central banks have likely finished their tightening cycles. A recent note from the firm suggested that we may even see rate cuts as early as H2 2024 “unless economic growth proves weaker than anticipated“.
- This in fact would be remarkable. It would mark an inflection point for risk assets, equities in particular, and likely spur a new wave of demand in buying stocks. In that scenario, US large-cap equities are in the prime position to benefit from such a rally.
If the worst of the rate hikes and inflation pain is behind us, then the market’s judgement with this latest advance may have some economic weight. Combined, these points evidence that primary undercurrents can extend markets higher into 2024, and are bullish for BBUS.
Technical factors for consideration
(i). Medium-term chart (coming weeks):
- Breakout from the downtrend in situ since August, coinciding with cloud top. Price line gapped above cloud top this week, lagging line cross confirmed the bullish signal.
- Turning line crosses above the standard line and above cloud-clear short-term momentum.
- Tremendous buying volume at reversal point, preceding price action. Buying volume has not dried up.
Figure 7.
Data: Updata.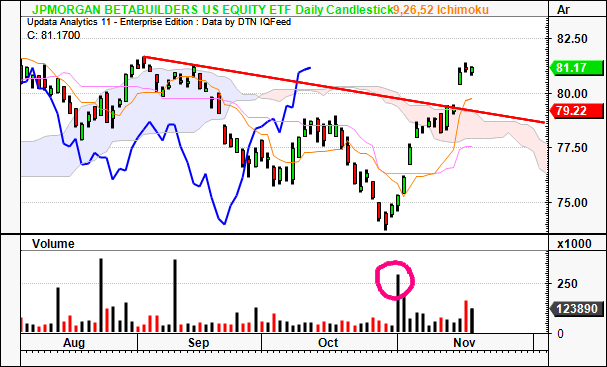
(ii). Long-term chart (coming months):
- There is still time to retrace the full leg from the ’21 high to the October ’22 low. We have already retraced 78% of this move and confirmed the 50% mark of the move. There has been heavy price competition at the 61.8% of the recovery.
- Next levels are $82, then $87 on the upside, which is the ’21 highs. On the downside, the levels are $74.80, then $72. Below $70 has us underneath the cloud.
Figure 8.
Data: Updata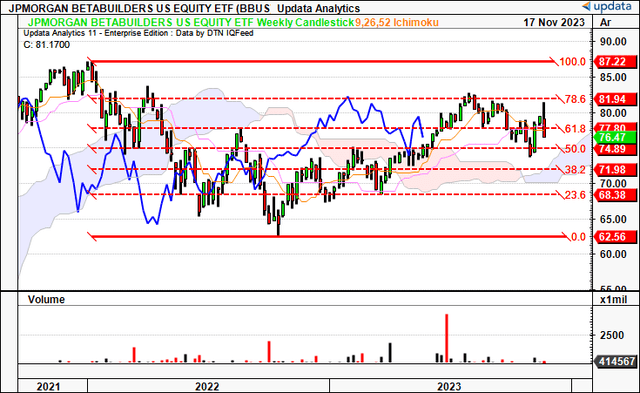
(iii). Upside targets to the $88s:
- We have upside targets of $88.40 based on point and figure studies looking to the coming weeks. These charts have eyed the moves down off the $80s well, so I am looking at $88 as a potential objective. This is above the 2021 high.
- In that vein, anything below $88 looks valuable and would be attractive if shares advance higher.
Figure 9.
Data: Updata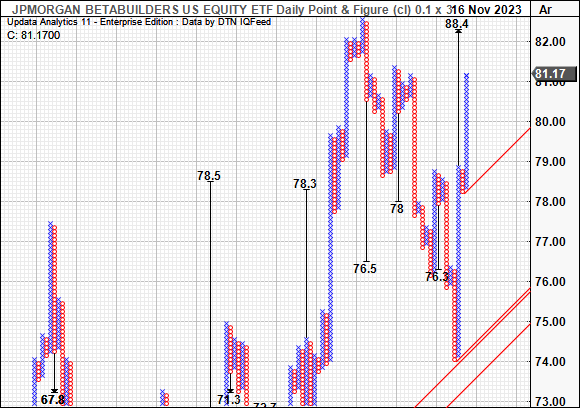
Discussion Summary
The market has changed character over the past few weeks. Underneath it all is a set of robust economic levers- (i) improved macro outlook, (ii) earnings projections, (iii) Less pressure from long rates.
Markets have already repriced benchmarks to reflect an optimistic business period next year. Analysts project the same. Considering this, an instrument like BBUS is incredibly attractive in my opinion. You have an almost perfect correlation to the benchmark indices, albeit at a fraction of the absolute cost. Per share investments are therefore more significant on a comparable basis. Plus a greater ability to deploy capital to meaningful positions. Net-net, I rate BBUS a hold for investors of a mid to long-term horizon.
")


 Q4 2023 Earnings Call Transcript")
")