

steinphoto/E+ via Getty Images
The Bank of Nova Scotia (NYSE:BNS) is a Canadian big bank, headquartered in Toronto, Canada, but with operations in many international locations. This article will briefly describe several aspects salient to an investment in BNS, including:
- Canadian banking system as a stable oligopoly & consequences for investors in Canadian banks
- BNS as possessing 4 different lines of business that add diversification
- The track record and characteristics of BNS’s stock returns
- The current state of BNS’s business lines
Canadian Banking Oligopoly
Canada’s banking system is an oligopoly with limited competition, comprised of five large banks that represent over 90% of market share for banking:
- Bank of Nova Scotia (or Scotiabank)
- Royal Bank of Canada (RY)
- Bank of Montreal (BMO)
- Toronto-Dominion Bank (TD)
- Canadian Imperial Bank of Commerce (CM)
For those who wish to read more on how this oligopoly arose, this working paper is a great read. This oligopoly has its origins in the early 19th century, whereby the British North America Act gave Canada’s federal government jurisdiction over banking. This is in contrast to the US, whose constitution did not prove for this power to its federal government. Over time, Canada raised the requirements for forming banks, while the US did not. The result was that Canadian banks were few in number and were relatively large, while the US had small banks each within their state boundaries.
This difference caused the importance of shadow banking to diverge in the two countries. As US banks were small and numerous, the shadow banking system grew in importance, while this did not happen in the more centralized Canadian system. This explains why Canada’s banking system is inherently more stable: it simply has far fewer actors and moving parts. As a result, Canada is far more resistant to having banking crises than the US, which is part of why Canadian banks tend to provide superior risk adjusted returns.
Below is an adapted screenshot of the portfoliovisualizer.com results of comparing the return characteristics of 5 largest Canadian banks (boxed in green) with the 5 largest American banks (JPM), (BAC), (C), (USB), and (WFC) (boxed in red):
5 US Banks, 5 Canadian Banks (Portfolio Visualizer)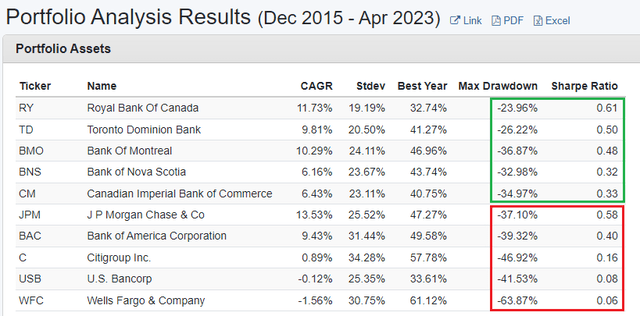
Quite simply put, the Canadian banks as a group generally have the larger CAGR, smaller standard deviations of returns, smaller drawdowns, and higher Sharpe ratios. If I were a closet indexer, I know which group of banks I would pick. Do note that this comparison was limited by the amount of historical data that the website has, so this chart should not be used as a basis for picking bank stocks based on CAGR for this relatively short time period alone.
However, the focus of this article will be the Bank of Nova Scotia, which stands out among these banks as being one of the most diversified financial companies.
Bank of Nova Scotia’s Four Business Lines
Bank of Nova Scotia is more than just a Canadian bank – it is geographically diversified across both North and South America! The four lines are:
- Canadian Banking
- International Banking
- Global Wealth Management
- Global Banking and Markets
I will briefly describe these segments, and also compare their performance between FY 2012 and FY 2022, so we get a sense of how much these lines of business have grown over the long run. All figures were extracted from the 2012 and 2022 annual reports found on SEDAR, the Canadian equivalent of EDGAR.
Canadian Banking
| FY 2012 | FY 2022 | |
| Net Income (millions CAD) | $1,938 | $4,763 |
| Return On Equity | 39.1% | 26.3% |
| Efficiency Ratio | 50.1% | 44.8% |
| Total Assets (billions CAD) | $225 | $430 |
| Total Liabilities (billions CAD) | $150 | $332 |
Canadian Banking provides a full suite of financial advice and banking solutions to over 10 million Retail, Small Business and Commercial Banking customers. It serves these customers through 941 branches and 3,725 automated banking machines (ABMs), as well as online, mobile and telephone banking. Canadian Banking also provides an alternative self-directed banking solution to over 2 million Tangerine Bank customers.
Out of the four lines of business, this is the fastest growing line. Additionally, the 26.3% returns on equity is truly fantastic. Out of the 4 lines of business, this is the largest and the brightest spot. Unfortunately the next 3 lines post less spectacular returns on equity, but still respectable growth rates.
International Banking
| FY 2012 | FY 2022 | |
| Net Income (millions CAD) | $1,774 | $2,418 |
| Return on Equity | 12.3% | 12.9% |
| Efficiency Ratio | 56.7% | 53.6% |
| Total Assets (billions CAD) | $109 | $207 |
| Total Liabilities (billions CAD) | $70 | $152 |
International Banking has over 11 million Retail, Corporate, and Commercial customers in the Pacific Alliance countries of Mexico, Chile, Peru, and Colombia, as well as Central America, the Caribbean, and Uruguay.
Global Wealth Management
| FY 2012 | FY 2022 | |
| Net Income (millions CAD) | $1,170 | $1,565 |
| Return on Equity | 14.5% | 16.2% |
Global Wealth Management delivers wealth management advice and solutions to clients across Bank of Nova Scotia’s footprint, namely both North and South America. Global Wealth Management serves over 2 million investment fund and advisory clients and administers over $500 billion in assets.
Out of the four lines of business, this is the second fastest growing line.
Global Banking and Markets
| FY 2012 | FY 2022 | |
| Net Income (millions CAD) | $1,492 | $1,911 |
| Return on Equity | 27.9% | 14.3% |
Global Banking and Markets provides corporate clients with lending and transaction services, investment banking advice and access to capital markets. GBM is a full-service wholesale bank in the Americas, with operations in Canada, the United States, Latin America, Europe and Asia-Pacific, for a total of 21 countries.
How did this mean for the dividend? Let’s do a YCharts plot:
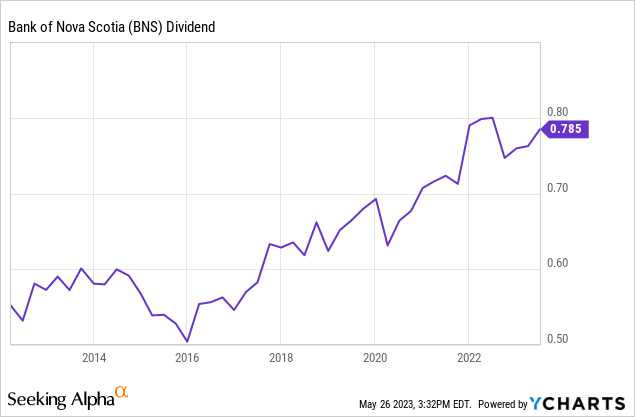
Note that this plot is in USD, while Bank of Nova Scotia pays dividends in CAD. Hence there is some noise in the plot due to foreign exchange fluctuations. But the point is clear – rising business performance naturally leads to a rising dividend. As the stock is currently yielding 6%, may dividend investors rejoice! However, because growth on 3 out of the 4 lines of business are relatively slow, the dividend payout ratio has been very gradually increasing:
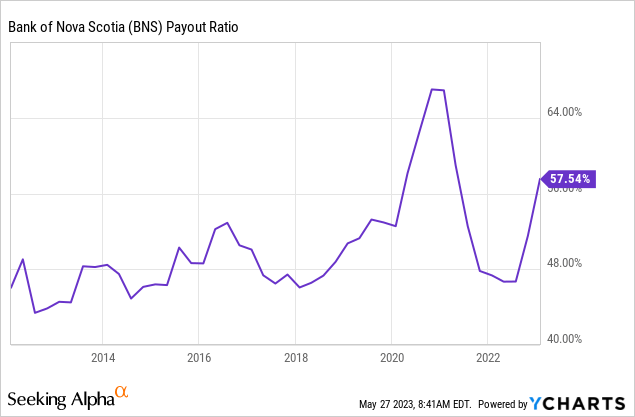
Here we see the payout ratio equal the high 40 percent range in 2012 but enter the high 50 percent range now. However, like we said, Canadian banking is oligopolistic and has little competition, allowing Canadian banks to post high levels of Tier 1 capital. I’ve compiled a time series of BNS’s CET1 ratio, and it is a testament to BNS’s stability, which is what dividend investors want. The trend from 2013 towards increasing conservatism back to what it once had is an added plus:
| FY Year End | CET1 ratio |
| 2012 | 13.6% |
| 2013 | 9.1% |
| 2014 | 10.8% |
| 2015 | 10.3% |
| 2016 | 11.0% |
| 2017 | 11.5% |
| 2018 | 11.1% |
| 2019 | 11.1% |
| 2020 | 11.8% |
| 2021 | 12.3% |
| 2022 | 11.5% |
| Q2 2023 | 12.3% |
Additionally, given the recent banking turmoil in the US, we might want to know about the liquidity status of BNS, even if it is in Canada. On the surface this might make sense, since both countries aggressively hiked interest rates in 2022 and 2023. Let’s begin with the fact (extracted from the Q2 2023 quarterly report) that Bank of Nova Scotia’s total assets are $1,349 billion CAD. I found and reformatted an exhibit in that same report that details the amount of those assets that are liquid:
Liquid Asset Pool at BNS (Q2 2023 Quarterly Report)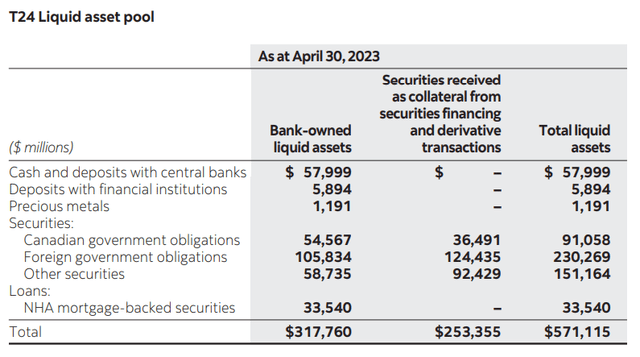
Clearly, Bank of Nova Scotia is in no danger of running into liquidity issues. Another plus for dividend investors.
Long Term Returns Profile – Peer Comparison
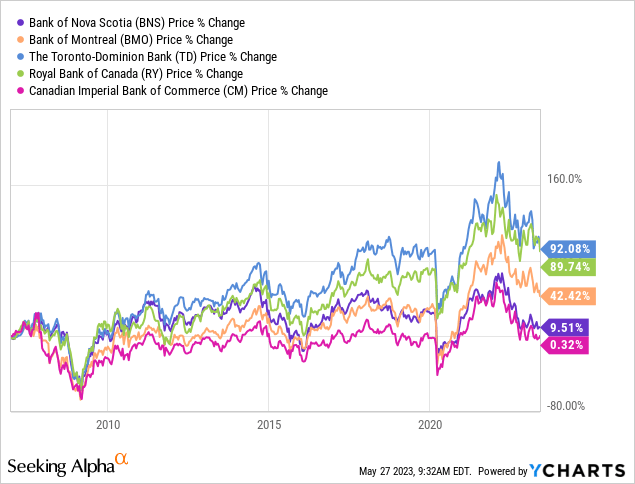
I will plot the share price trajectory and dividend yield trajectory of the Big 5 Canadian banks and see where BNS fits in respect with its peers, and examine how exactly does BNS provide returns to the shareholder.
Share Price
Dividend Yield
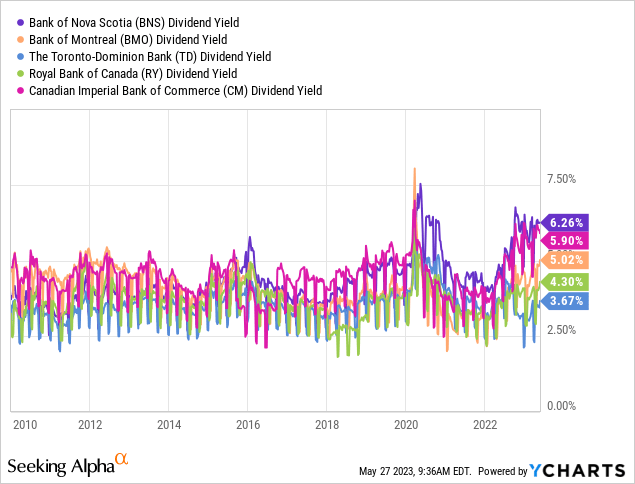
The price chart was picked to start in 2007 to capture the Great Financial Crisis caused by housing markets. Most notably, BNS and CM are the two banks with the lowest price appreciation. This is not the whole story, however. BNS (and CM) are the two banks with the highest dividend yield, BNS yielding currently a whopping 6.26%. It’s not necessarily true that BNS delivers lower returns – rather, almost all of its returns are in the form of the dividend payout.
Indeed, we can compare the two extreme companies BNS and TD in total return on Portfolio Visualizer:
- TD – low dividend yield, high price appreciation
- BNS – high dividend yield, low price appreciation
Long Run Total Returns, BNS and TD (Portfolio Visualizer)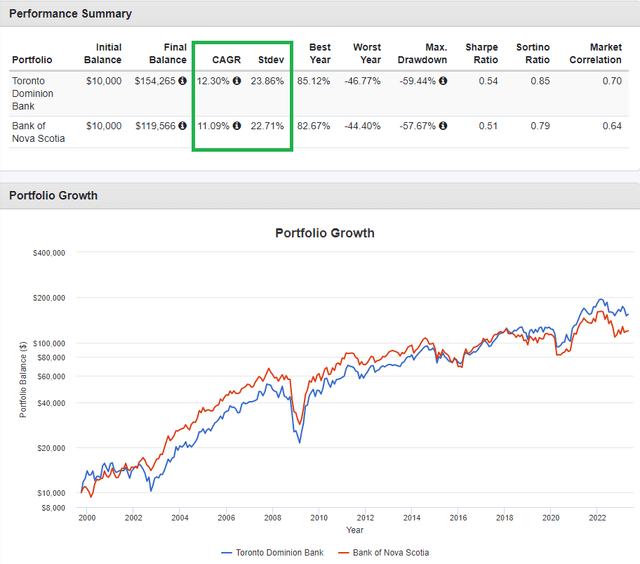
Over the very long run (2000 – present), these two banks provide very similar return and volatility profiles, suggesting that even though their mode of producing shareholder returns are different, their actual total returns are similar. That said, since BNS provides returns in dividends, there is an inefficiency in respect with having the pay dividend taxes, unless the shares are held in a retirement account.
Summary
To summarize the main points:
- Bank of Nova Scotia operates as one of five oligopolistic parties in the Canadian banking system, benefiting from limited competition.
- This bank is a slow but steady grower in a mature industry and market, with Canadian (domestic) banking as its brightest spot in terms of size of the line of business and returns on equity.
- Bank of Nova Scotia has steadily hiked its dividend at the same time as growing its earnings, and currently yields 6%.
- Its capital ratios and liquidity position suggest that it is a conservatively managed bank where management values stability.
- This is a good investment for someone seeking a high-yielding investment that has little potential for concern or excitement – a reliable income position.
- BNS provides the vast majority of its returns in its dividend yield rather than in share price appreciation.
")


 Q1 2025 Earnings Name Transcript")


