

Kwarkot
In the long run, assets that generate and grow cash earnings should see their prices move in proportion to their earnings. In the shorter run, though, prices vary as earnings multiples change. And the shorter run sometimes lasts many years.
One of the features of this century has been multiple expansion in the valuation of assets. At the moment, some of this has been undone, especially for REITs.
One can estimate the multiple expansion as the difference between the total return and the economic return. The economic return is the sum of dividend yield and the growth of cash earnings.
I last looked at earnings multiples for REITs in July 2022, here. At that time, looking at 23 years ending in 2019, my conclusion was that total returns in the markets had been above economic returns for some selected REITs by a CAGR of 4% to 5%.
By now we are closer to done with the pandemic, though still subject to knock-on aftereffects. We may yet get the recession that has been described as “imminent” for nearly 3 years. Or not.
And the current bear market, driven largely by high interest rates, still has REIT (and other) prices suppressed. We will see whether the recent rally lasts, but it would have a long way to go to reach the 2021 highs.
What is certain is that REITs overall will grow their per share earnings with time. The basic REIT model is very robust.
But that says little about what pricing will be. Here we seek some perspective on REIT pricing and growth, using the past 20 years for context.
Big Picture Factors
Eventually, we will focus on a few REITs as examples. In doing that we risk being impacted by survivor bias. Survivor bias occurs because the surviving firms are the ones that succeeded, and the losses on others vanish from view and the results after they leave some collection being tracked.
This is a real issue for the S&P 500. It is interesting that the equal-weight S&P 500 index may be much less impacted.
For REITs, though, my view is that survivor bias is a much smaller issue. The reason is that REITs very rarely liquidate and almost never go bankrupt.
What happens to them is that they get bought or merged out of existence, with more or less the invested capital returned to shareholders. If a theoretical investor kept their capital invested in REITs, then they could expect to get the returns associated with their capital allocation.
But the other thing about REITs is the dramatic changes in the overall sector. From nothing 15 years ago, Data Centers and Infrastructure (mainly tower) REITs now dominate the total REIT Market Cap, which has increased a factor of 30 across the past 30 years. Where this plays out is that overall index construction is tricky and index performance can be affected by details nobody knows.
The NAREIT all equity index shows a 9.3% CAGR of total return for 20 years through September. The top 10 holdings make up nearly 50% of the index. The total of 141 holdings are free-float weighted. The NAREIT index is far more concentrated than the S&P 500, which has produced a 10.6% total return over the same period.
In contrast, the Vanguard Real Estate ETF (VNQ) shows a 6.5% CAGR of total return for 20 years through September. With its 160 holdings, the ETF “seeks to track the investment performance of the MSCI US Investable Market Real Estate 25/50 Index. … Using a full-replication process, the fund seeks to hold all stocks in the same capitalization weighting as the index.”
So even though survivorship bias is arguably not a big factor, index management clearly is. My takeaway here is that you can’t really trust either index. Their history is opaque and the outcomes differ in mysterious ways.
Continuing this big-picture saga, here is another really dumb way to look at REIT history, from NAREIT, based on cap-weighted Funds From Operations (“FFO”). This plot is through Q2 and the rightmost value would be a bit lower today.
NAREIT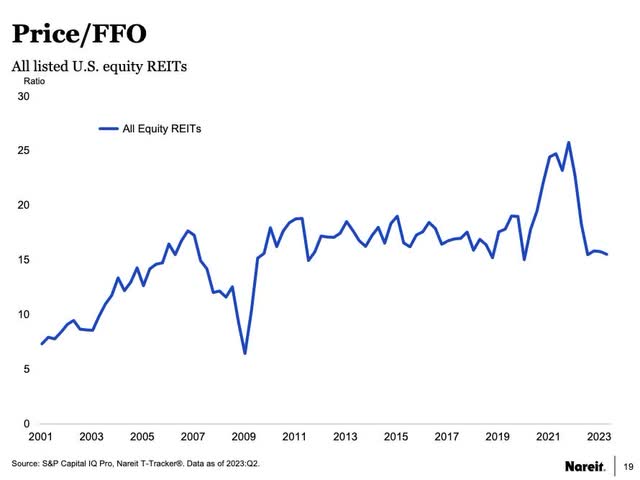
The only virtue of FFO as a measure of earnings is that it is easy to obtain. But the ratio of FFO to actual cash earnings varies by more than 50%. The variation is mainly by REIT subsector, but still, the plot here is based on an overall FFO that is a weighted average whose relative components vary enormously with time in unquantified ways.
[Also, although Adjusted FFO is intended to get after cash earnings, it too fails to do so accurately. I discussed the issues here.]
A few big trends do seem clear from this plot, though.
- Save for the Great Recession (2008 thru 2010) and ZIRP period (2021), REIT earnings multiples seem to have been stable from 2006 to the present.
- If you had been smart enough to bet big against REITs in 2021, you might be reading this from your yacht today. Alas, all I did was diversify some holdings outside of REITs during that year, but at least, that helped improve my retirement security.
- REIT earnings multiples more than doubled from 2001 through 2007.
On the one hand, the REIT sector dates, in a practical sense, from the mid-1990s. In the years from then until 2007, it went through a lot of consolidation. Public REITs became more appealing as investments as a result.
Some other history also can help us:
RP Drake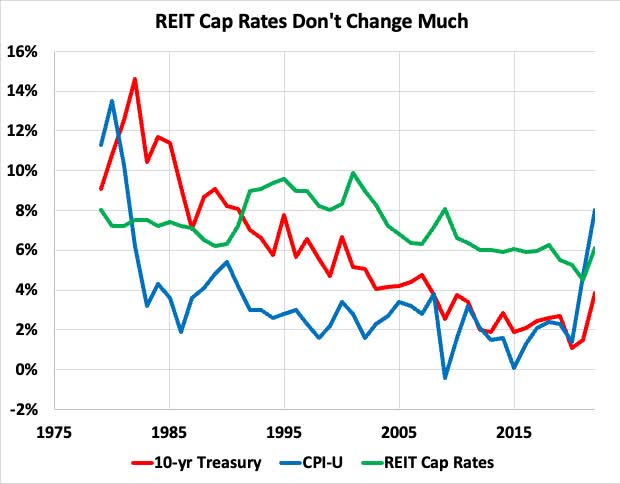
Some 21st century trends are notable here. Key parameters have been remarkably unchanged, except during the brief period of ZIRP idiocy.
- By 2008 10-year Treasury Rates were near 3%, where they stayed.
- By 2008 (implied) REIT cap rates had dropped to 6%, where they stayed.
- Inflation averaged less than 2% from 2008 to 2021.
Far too many people think that period from 2008 through 2019 represents a “normal” to which these parameters will return.
Consider for contrast the US in 2003 (20 years ago):
- 10-year Treasury Rates were above 4%.
- Implied REIT cap rates were near 8%.
- Inflation was running at near a 3% average.
Sound familiar?
Actual property cap rates have also moved upward recently (the implied cap rates shown are based on market pricing). They vary with sector but are typically today 100 to 200 bps higher than they were running in the 2010s. And when property cap rates go up, REIT earnings multiples should drop, as they have.
It seems to me that these big-picture considerations mean that:
- We don’t have an accurate knowledge of overall REIT returns.
- Cap rate changes will impact REIT earnings multiples.
- Treasury rate changes will impact REIT earnings multiples.
A View By Subsector
NAREIT also maintains a list of returns from all REITs divided into subsectors, which it publishes monthly in REITWatch. They show the annual price return and total return for each sector.
This, in my view, is far more reliable data than the overall REIT indices. I used the tables to construct the (mostly) 20-year CAGRs by subsector. One finds considerable diversity amongst the subsectors:
RP Drake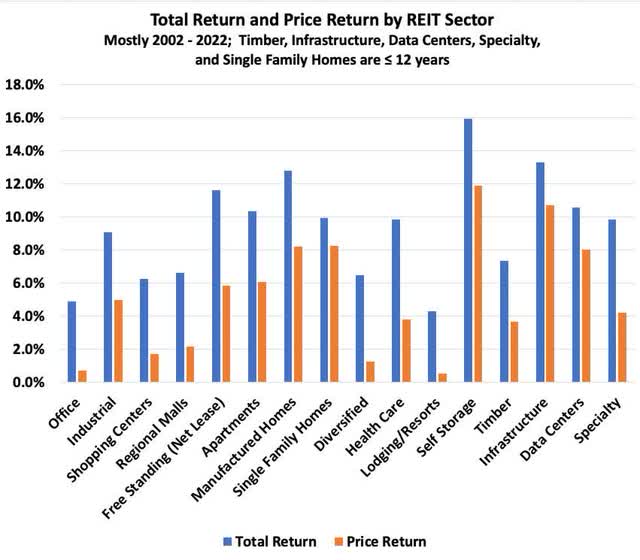
Very broadly, one can see here that the 20-year CAGR of total return is near 10%. That should be the case for REITs, with price returns and dividend yields both approaching 5%.
The subsectors with price returns significantly below 5% include Offices, Shopping Centers, and Regional Malls, for all of which the price index has dropped significantly in recent years. My view is that Office may be a long story but quality REITs in the other two categories will outperform going forward. They were beat down by the market from 2016 through today, despite net growing earnings per share.
Health Care, in contrast, is dominated by Welltower (WELL) and Ventas (VTR), both of which have been very slow at growing per share earnings for a very long time. And the Diversified subsector has always been a disaster and still is. We will ignore other underperforming sectors today.
What matters here is that the performance of the individual REITs we examine below has been reasonably close to that of their sector. This shows that selection bias is a minimal issue (as is survivor bias).
Finally, here is a table of the data shown in the previous graphic. It also has an added column showing the ratio of (September 30) Price to 2024 FFO by sector.
RP Drake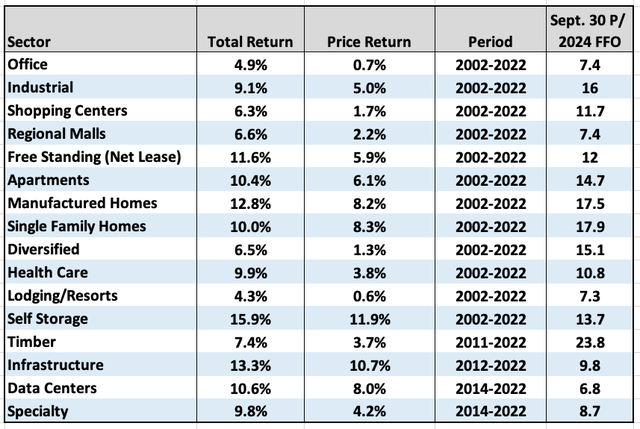
You can see that P/FFO varies by more than a factor of 3, underpinning one aspect of the inadequacy of the first plot shown above. I discussed some of the subsector variations here.
Performance of Selected REITs
With all the above context, let’s look at specific REITs from 5 subsectors, all with strong credit ratings:
- Public Storage — Self Storage
- AvalonBay (AVB) — Multifamily
- Simon Property Group (SPG) — Regional Malls
- Federal Realty Investment Trust (FRT) — Shopping Centers
- NNN REIT (NNN) — Free Standing (Net Lease)
Note that the returns of each one (seen below) are not far from the returns of their subsector, shown above. Note also that they all had good track records by 2002. Investing in them then would not have been taking a flyer on some small unknown.
Here are the total returns of these five over 20 years shown on a semi-log plot, so that compounding growth follows a straight line. The overall trend has been near 11%, save that some have fallen short of that in recent years.
RP Drake from YCHARTS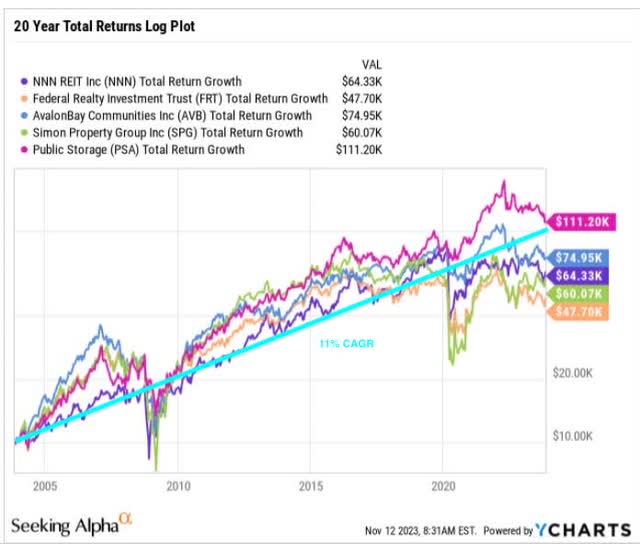
The two REITs operating retail locations, FRT and SPG, have been more or less flat since 2016. This reflects market reaction to the overblown “retail apocalypse.” NNN REIT, which owns but does not operate retail, did somewhat better.
In contrast, AVB and PSA did see increasing total returns since 2016. Both have fallen since 2021, a stellar year for the self-storage sector.
Now let’s look at overall market performance and economic performance for these five REITs. To start, suppose you invested $50k across them in 2002, did no subsequent rebalancing, and just ignored them. Your portfolio would have beaten the S&P 500 by nearly 300 bps, as is shown here.
RP Drake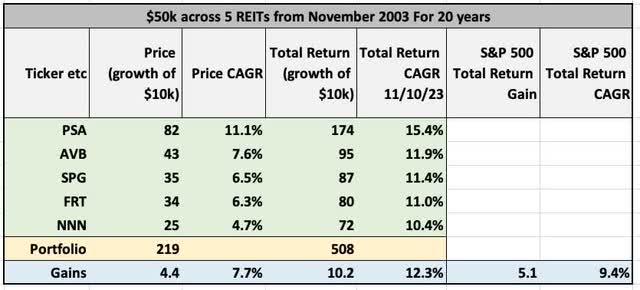
Consider next the economic returns. These are evaluated as the sum of the CAGRs for FFO/sh and dividends. (The CAGR of FFO/sh typically will track the CAGR of better earnings measures, so the absolute inaccuracy of FFO is less important.)
RP Drake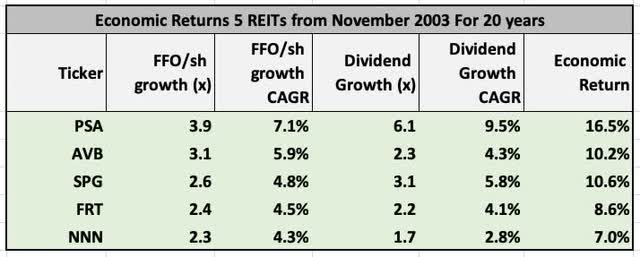
Mostly we see that the economic return is a bit below the total return (to November 10) for three of these. The economic returns of FRT and NNN fall quite a bit short of the total returns, showing that the markets gave them a higher multiple over that 20-year period. And this is despite being in the depths of a bear market today.
We can then estimate the annual rate of expansion of the earnings multiples by taking the difference between economic and total returns. This is shown here:
RP Drake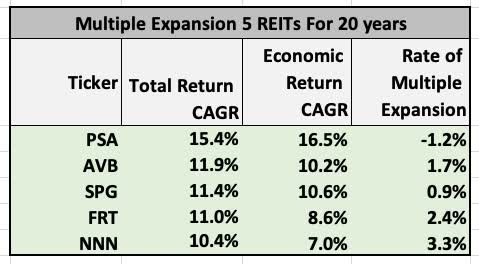
So from 2003 through today, the markets have credited significantly higher earnings multiples to FRT and NNN and somewhat higher ones to AVB and SPG. Storage, in contrast, is priced low enough to have seen its multiple decline modestly.
The story is a bit different if we look at the multiple expansion that was embedded in the early 2022 highest price. We see this in the fourth column here:
RP Drake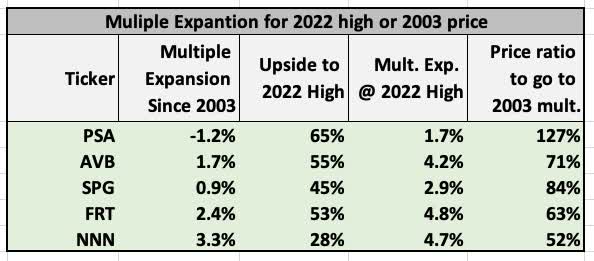
The difference from then to now runs 200 to 300 bps. At that time (early 2022), PSA and SPG had seen relatively modest multiple expansion since 2003 while AVB, FRT, and NNN had seen an expansion with a CAGR of 4% to 5%. Over 20 years, this is a factor of 2.4x in price that did not reflect economic performance.
One has to wonder where REIT pricing would go if either suddenly or slowly the market went back to the 2003 multiple. As to suddenly, if the price went back from today to the earnings multiple of 2003, it would change from here as shown in the fifth column of the table.
This is sobering. REITs are better investments today than they were then, but not as much as some promoters sometimes advertise.
An immediate return to 2003 earnings multiples seems unlikely to me. It would be far more consistent with historical market patterns to see a pretty big upward bounce from here.
Looking Ahead
But if it does turn out that over time we next see a secular bond bear market, with slowly increasing yields, then the earnings multiples are likely to steadily decay. As these REITs will keep growing FFO/sh in the mid-single digits, decaying earnings multiples would be more likely to flatten price returns than to drive down prices.
Dividends, however, will continue to be paid and to grow. We don’t have REIT data from the 1970s but, across that decade of inflation and high interest rates, real dividends held up far better than real stock prices. (This was also true across the 1930s.)
Returning to REIT prices, will the P/FFO ratios from the 2010s, shown in the first plot above, continue to represent “normal?” I see absolutely no reason why they should.
The actual path taken by interest rates and cap rates will have a lot to say about where REIT pricing actually goes. My best guess is that P/FFO and other, better ratios are unlikely to return all the way to their 2003 values.
REITs are higher-quality investments than they were in 2003. Cap rates seem likely to stabilize or reverse and remain below 8% overall in the near term. But I could be wrong.
A lot of the above considerations apply to “value stocks” generally. The implication, to my mind, is that if your financial plan depends on getting total returns near 10% during the next decade or two, then it is at severe risk of failure.
In contrast, if your plan is based on modestly growing dividend income from solid companies, then it has a good chance of succeeding. There have been great opportunities across the past 18 months to get some of those dividends at a high yield on cost.
That opportunity is not gone yet, but it soon will be.


")


")


