pcess609
Markets Review
Sources: CAPS CompositeHubTM, Bloomberg
Past performance is not indicative of future results. Aristotle Value Equity Composite returns are presented gross and net of investment advisory fees and include the reinvestment of all income. Gross returns will be reduced by fees and other expenses that may be incurred in the management of the account. Net returns are presented net of actual investment advisory fees and after the deduction of all trading expenses. Aristotle Capital Composite returns are preliminary pending final account reconciliation. Please see important disclosures at the end of this document.
The U.S. equity market rebounded, as the S&P 500 Index rose 11.69% during the period. Concurrently, the Bloomberg U.S. Aggregate Bond Index rallied, increasing 6.82% for the quarter. In terms of style, the Russell 1000 Value Index underperformed its growth counterpart by 4.66%.
Gains were broad-based, as ten out of the eleven sectors within the Russell 1000 Value Index finished higher. Real Estate, Financials and Information Technology were the best-performing sectors. Meanwhile, Energy was the only sector to finish in the red, while Consumer Staples and Health Care gained the least.
Data released during the period showed that the U.S. economy had accelerated in the third quarter, with real GDP rising at an annual rate of 4.9%—the fastest pace of growth in nearly two years. The robust results were driven by increases in consumer spending and inventory investment. Additionally, single-family housing starts rose 18% month-over-month in November, and the labor market remained tight with 3.7% unemployment. Meanwhile, inflation continued its downward trend, as the annual CPI fell from 3.7% in September to 3.1% in November. The drop was primarily driven by softening energy prices, as both WTI and Brent fell below $80 a barrel. These developments combined to send longer-term interest rates lower, with the 10-year U.S. Treasury yield falling over 70 basis points during the quarter to finish at 3.88%.
As a result of easing inflation, combined with potentially slowing economic activity and a strong but moderating job market, the Federal Reserve (Fed) held the benchmark federal funds rate steady during the quarter. Chair Jerome Powell stated that the central bank’s policy rate is likely at or near its peak for the current tightening cycle, while the Federal Open Market Committee members’ median estimates indicate three quarter-point cuts in 2024.
On the corporate earnings front, results were strong, as 82% of S&P 500 companies exceeded EPS estimates, leading to 4.7% growth in earnings for the Index. Looking forward, analysts expect earnings to accelerate in 2024, with growth of 11.5% year-over-year.
Lastly, in U.S. politics, after backing a bipartisan stopgap funding bill to stave off a partial government shutdown, Congressman Kevin McCarthy was removed as speaker of the United States House of Representatives. This marked the first time in American history that a speaker of the House was ousted through a motion to vacate. Subsequently, Congressman Mike Johnson was elected as McCarthy’s replacement.
Annual Markets Review
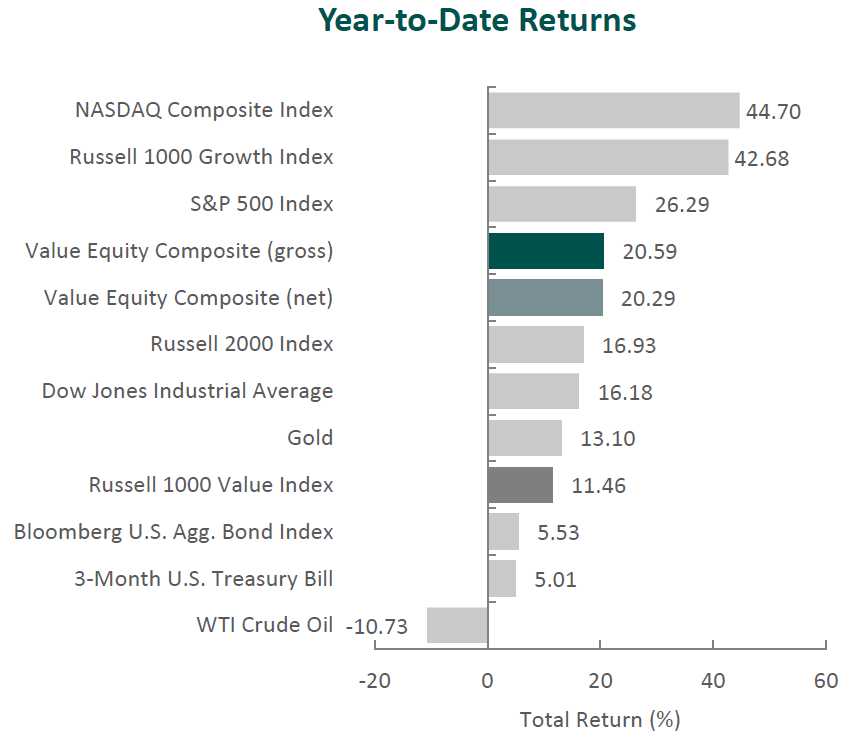
After a tumultuous year in 2022, the U.S. equity market rallied in 2023, as the S&P 500 Index posted a full-year return of 26.29%. The increase was primarily driven by the performance of the seven largest companies in the Index, which were responsible for 62% of the S&P 500’s gains. Additionally, after underperforming value last year by the largest amount since 2000, growth recovered, as the Russell 1000 Growth Index outperformed the Russell 1000 Value Index by 31.22% for the year. Meanwhile, the fixed income market also rebounded, as the Bloomberg U.S. Aggregate Bond Index rose 5.53% in 2023.
Macroeconomic news was dominated by inflation, central bank policies, regional bank failures and geopolitical conflicts, while other topics, such as artificial intelligence and congressional politics, made headlines as well. Economic data points were mixed throughout the year, and corporate earnings were just as unpredictable.
Given the multitude of headlines in a year and their fickle nature, short-term returns are often volatile and inconsistent. Therefore, we instead choose to focus on business fundamentals over the long term. By finding great businesses that are undervalued with actionable catalysts within our investment time horizon, we believe we can provide consistent and lasting value to our clients.
Performance and Attribution Summary
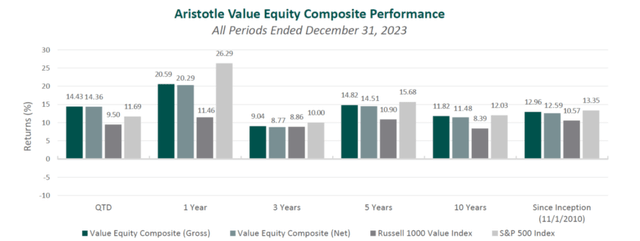
For the fourth quarter of 2023, Aristotle Capital’s Value Equity Composite posted a total return of 14.43% gross of fees (14.36% net of fees), outperforming the 9.50% return of the Russell 1000 Value Index and the 11.69% return of the S&P 500 Index. Please refer to the table for detailed performance.
| Performance (%) | 4Q23 | 1 Year | 3 Years | 5 Years | 10 Years |
|---|---|---|---|---|---|
| Value Equity Composite (gross) | 14.43 | 20.59 | 9.04 | 14.82 | 11.82 |
| Value Equity Composite (Net) | 14.36 | 20.29 | 8.77 | 14.51 | 11.48 |
| Russell 1000 Value Index | 9.50 | 11.46 | 8.86 | 10.90 | 8.39 |
| S&P 500 Index | 11.69 | 26.29 | 10.00 | 15.68 | 12.03 |
Source: FactSetPast performance is not indicative of future results. Attribution results are based on sector returns which are gross of investment advisory fees. Attribution is based on performance that is gross of investment advisory fees and includes the reinvestment of income.
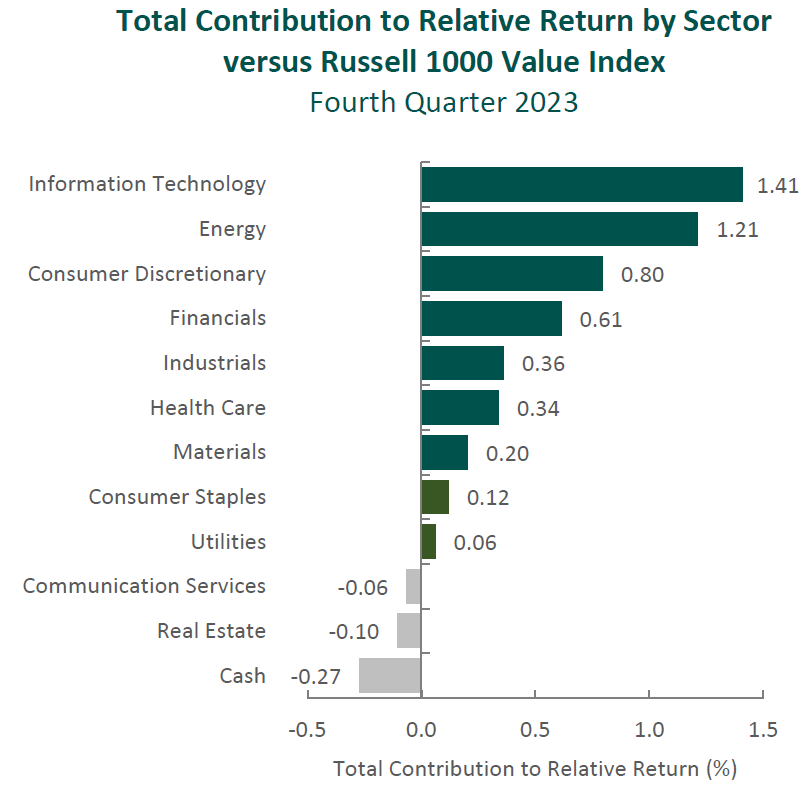
The portfolio’s outperformance relative to the Russell 1000 Value Index in the fourth quarter can be primarily attributed to security selection, while allocation effects also had a positive impact. Security selection in Financials, Information Technology and Consumer Discretionary contributed the most to relative performance. Conversely, underweights in Financials, Real Estate and Industrials detracted. (Relative weights are the result of bottom-up security selection.)
Contributors and Detractors for 4Q 2023
| Relative Contributors | Relative Detractors |
|---|---|
| Lennar (LEN) | Corteva (CTVA) |
| Capital One Financial (COF) | Coterra Energy (CTRA) |
| Microsoft (MSFT) | Constellation Brands (STZ) |
| Qualcomm (QCOM) | Alcon (ALC) |
| U.S. Bancorp (USB) | Mitsubishi UFJ Financial (MUFG) |
Lennar, one of the nation’s largest homebuilders, was the primary contributor for the period. Increasing mortgage rates reached a peak during the fourth quarter, but Lennar’s dynamic pricing model, combined with its digital marketing platform and buyer incentives, continued to drive volume and generate cash flow, all while reducing construction cycle times, returning capital to shareholders and further lowering the company’s debt. In 2023, Lennar delivered 73,000 homes (a 10% year-over-year volume increase).The company’s land light strategy also continues to move forward, with 76% of land now controlled through options, as compared to 69% a year ago (and less than 30% in 2015).Over our decade-plus investment in Lennar, we have admired the management team’s ability to respond to changing housing dynamics. We believe Lennar’s current land and pricing strategyshould continue to support enhanced FREE cash flow generation. In addition, Lennar’s strong balance sheet, prudent inventory management and further ability to implement cost and production efficiencies position it well to meet demand amid the decade-long undersupply of homes in the U.S.
Corteva, the seed and crop protection company, was the largest detractor during the quarter. Following robust orders during the 2020-2022 period, customer destocking persisted throughout 2023, particularly in Brazil, causing Corteva to lower 2023 revenue and profit guidance to -2% and -3% year-over-year, respectively. While the crop protection business appears to be, in our view, at or near a cyclical bottom, the seed business remained resilient, with +14% year-over-year price/mix effects more than offsetting the 12% fall in volumes during the third quarter. We are encouraged by management’s actions, including further optimization of the crop protection business and Corteva’s FREE cash flow generation during this challenging period. Despite cyclical headwinds, the company continues to execute on catalysts we previously identified, including margin expansion via improved pricing and product mix, as well as reduced royalty expenses.
Recent Portfolio Activity
| Buys | Sells |
|---|---|
| Teledyne Technologies (TDY) | Cincinnati Financial (CINF) |
| U.S. Bancorp |
During the quarter, we sold our position in Cincinnati Financial and invested in two new positions: Teledyne Technologies and U.S. Bancorp.
We first invested in property and casualty insurer Cincinnati Financial during the fourth quarter of 2020. We continue to admire the company’s prudent underwriting, strong relationships with agencies and financial strength, as evidenced by 60+ consecutive years of dividend increases. Catalysts that have been realized during our holding period include market share gains for agencies and areas that were entered in prior years. We continue to admire this business but decided to sell in favor of what we think is a more optimal opportunity.
Teledyne Technologies, Inc.
Headquartered in Thousand Oaks, California, Teledyne Technologies is an industrial technology company which manufactures sensors, cameras, instruments and systems that enable its customers to monitor, analyze and distribute information. Teledyne focuses on end markets that demand advanced technology and high reliability, such as aerospace and defense, environmental monitoring, electronics design and development, medical imaging, oceanographic research, and deepwater activities. Teledyne’s offerings are supported by decades of research and development enabling customers at all wavelengths and all applications, from deep sea to deep space.
Teledyne’s roots go back to 1960 and Founder/CEO Henry Singleton; however, the current version of Teledyne was spun out of Allegheny in 1999. At the time, Teledyne was a low-margin aerospace and defense company with the U.S. government accounting for ~50% of sales, non-U.S. markets accounting for ~15% and digital imaging 0%. Today, Teledyne earns a ~25% EBITDA margin, digital imaging accounts for >50% of sales, the U.S. government is ~25% and non-U.S. markets are ~50% of sales. The company has transformed itself over the years via dozens of mergers and acquisitions, most meaningfully through the 2021 purchase of FLIR Systems, a key catalyst discussed below.
High-Quality Business
Some of the quality characteristics we have identified for Teledyne include:
- Highly engineered, premium priced, critical technologies sold across a diverse range of end markets;
- Simple concepts rigorously applied: A decentralized management structure, along with an innovative yet cost-conscious culture, has resulted in steady margin expansion; and
- History of successful acquisitions (>50 in past 15 years), as evidenced by compounding of FREE cash flow and value creation.
Attractive Valuation
Using our estimates of normalized cash earnings power, we believe Teledyne’s current stock price is offered at a discount to our estimate of the company’s intrinsic value. We believe the improvements in the company’s business mix and FREE cash flow generation power following the FLIR Systems acquisition are not fully appreciated by the market.
Compelling Catalysts
Catalysts we have identified for Teledyne, which we believe will propel the business forward over our three- to five-year investment horizon include:
- Continued integration of FLIR Systems leading to improved profitability and further penetration of attractive end markets (e.g., thermal imaging, with particular potential in autonomous driving);
- Further market share gains, as Teledyne is uniquely positioned to benefit from increased demand for surveillance and unmanned systems in both commercial and non-commercial end markets (e.g., carbon and air quality monitoring, industrial automation, social services, defense); and
- Improving balance sheet, as FREE cash flow has been dedicated to lowering acquisition-related debt (<2.0x net debt to EBITDA) and can now, once again, be utilized for value-enhancing acquisitions.
U.S. Bancorp
Headquartered in Minneapolis, Minnesota, and with origins dating back to 1863, U.S. Bancorp (USB) is a diversified regional bank that operates over 2,400 branches across 26 states, primarily in the Western and Midwestern U.S. As of September 30, 2023, the company had $668 billion in assets, over $518 billion in deposits and more than $375 billion in loans, making it the fifth-largest retail bank in the country.
The bank offers a variety of services, including retail as well as commercial banking, credit cards, investment management and trust services. At the end of 2022, USB acquired Union Bank from Mitsubishi UFJ Financial (also a Value Equity holding) for approximately $8 billion, adding $82 billion in assets to its balance sheet. This was the bank’s biggest acquisition since 2001 and provides the company with a larger presence on the West Coast, particularly in California.
High-Quality Business
Some of the quality characteristics we have identified for USB include:
- Proven operating efficiency having generated returns above peers and its own cost of capital for the last 15 years;
- Balanced loan portfolio and mix of fee-generating businesses (~40% of revenues), such as payments and corporate trusts, which often have high barriers to entry and scalability due to fixed cost structures;
- Economies of scale and attractive funding profile with high deposit share (e.g., average deposit share of 8% per state, with top five positions in 17 states); and
- History of increasing its dividend and shrinking shares outstanding (with an average annual decrease of 2% over the past decade).
Attractive Valutaion
Using our estimates of normalized earnings, we believe USB’s current stock price is offered at a discount to our estimate of the company’s intrinsic value. We believe USB is well positioned to improve its market position while maintaining an attractive return profile.
Compelling Catalysts
Catalysts we have identified for USB, which we believe will cause its stock price to appreciate over our three- to five-year investment horizon, include:
- Enhanced revenues and cost-savings through expense synergies following the recent acquisition of Union Bank;
- Continued balanced and relatively low-risk loan growth coupled with deposit share gains in most geographies in which it operates;
- Improvement in return-on-assets through both efficiency gains and a more robust product offering; and
- Increased returns to shareholders following a near-term period when, as a result of enhanced regulatory requirements due to higher total assets from the Union Bank acquisition, share buybacks were paused.
Conclusion
With volatile economic data points, changing central bank policies, shocks to the banking system and various geopolitical conflicts, 2023 was full of headline-worthy news. However, as the market’s attention quickly shifted from one macro event to the next, we remained true to our bottom up, fundamental investment philosophy.
As such, instead of chasing the next headline or “placing bets” on short-term predictions, our focus remains on business fundamentals and what is analyzable in the long run. For over the past quarter century, we have dedicated ourselves to a “bottom-up” process of identifying high-quality businesses trading at meaningful discounts to intrinsic value, that possess catalysts which are underway and within management’s control. By doing so, we believe we can find long-term success regardless of the macroeconomic environment or news of the day.
Disclosures
The opinions expressed herein are those of Aristotle Capital Management, LLC (Aristotle Capital) and are subject to change without notice. Past performance is not a guarantee or indicator of future results. This material is not financial advice or an offer to purchase or sell any product. You should not assume that any of the securities transactions, sectors or holdings discussed in this report were or will be profitable, or that recommendations Aristotle Capital makes in the future will be profitable or equal the performance of the securities listed in this report. The portfolio characteristics shown relate to the Aristotle Value Equity strategy. Not every client’s account will have these characteristics. Aristotle Capital reserves the right to modify its current investment strategies and techniques based on changing market dynamics or client needs. There is no assurance that any securities discussed herein will remain in an account’s portfolio at the time you receive this report or that securities sold have not been repurchased. The securities discussed may not represent an account’s entire portfolio and, in the aggregate, may represent only a small percentage of an account’s portfolio holdings. The performance attribution presented is of a representative account from Aristotle Capital’s Value Equity Composite. The representative account is a discretionary client account which was chosen to most closely reflect the investment style of the strategy. The criteria used for representative account selection is based on the account’s period of time under management and its similarity of holdings in relation to the strategy. Recommendations made in the last 12 months are available upon request.
Returns are presented gross and net of investment advisory fees and include the reinvestment of all income. Gross returns will be reduced by fees and other expenses that may be incurred in the management of the account. Net returns are presented net of actual investment advisory fees and after the deduction of all trading expenses.
All investments carry a certain degree of risk, including the possible loss of principal. Investments are also subject to political, market, currency and regulatory risks or economic developments. International investments involve special risks that may in particular cause a loss in principal, including currency fluctuation, lower liquidity, different accounting methods and economic and political systems, and higher transaction costs. These risks typically are greater in emerging markets. Securities of small‐ and medium‐sized companies tend to have a shorter history of operations, be more volatile and less liquid. Value stocks can perform differently from the market as a whole and other types of stocks.
The material is provided for informational and/or educational purposes only and is not intended to be and should not be construed as investment, legal or tax advice and/or a legal opinion. Investors should consult their financial and tax adviser before making investments. The opinions referenced are as of the date of publication, may be modified due to changes in the market or economic conditions, and may not necessarily come to pass. Information and data presented has been developed internally and/or obtained from sources believed to be reliable. Aristotle Capital does not guarantee the accuracy, adequacy or completeness of such information.
Aristotle Capital Management, LLC is an independent registered investment adviser under the Advisers Act of 1940, as amended. Registration does not imply a certain level of skill or training. More information about Aristotle Capital, including our investment strategies, fees and objectives, can be found in our ADV Part 2, which is available upon request. ACM-2401-44
Performance Disclosures
Sources: CAPS CompositeHubTM, Russell Investments, Standard & Poor’s
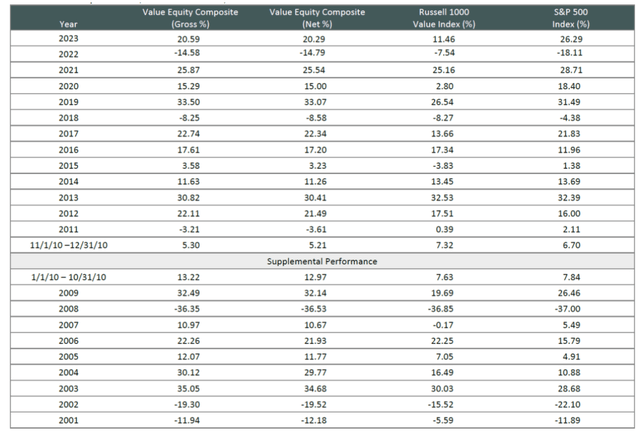
Composite returns for all periods ended December 31, 2023 are preliminary pending final account reconciliation.
Past performance is not indicative of future results. The information provided should not be considered financial advice or a recommendation to purchase or sell any particular security or product. Performance results for periods greater than one year have been annualized. The Aristotle Value Equity strategy has an inception date of November 1, 2010; however, the strategy initially began at Mr. Gleicher’s predecessor firm in October 1997. A supplemental performance track record from January 1, 2001 through October 31, 2010 is provided above. The returns are based on two separate accounts and performance results are based on custodian data. During this time, Mr. Gleicher had primary responsibility for managing the two accounts, one account starting in November 2000 and the other December 2000.
Returns are presented gross and net of investment advisory fees and include the reinvestment of all income. Gross returns will be reduced by fees and other expenses that may be incurred in the management of the account. Net returns are presented net of actual investment advisory fees and after the deduction of all trading expenses.
Index Disclosures
The Russell 1000 Value® Index measures the performance of the large cap value segment of the U.S. equity universe. It includes those Russell 1000 Index companies with lower price-to-book ratios and lower expected growth values. The S&P 500® Index is the Standard & Poor’s Composite Index of 500 stocks and is a widely recognized, unmanaged index of common stock prices. The Russell 1000® Growth Index measures the performance of the large cap growth segment of the U.S. equity universe. It includes those Russell 1000 companies with higher price-to-book ratios and higher forecasted growth values. The Russell 2000® Index measures the performance of the small cap segment of the U.S. equity universe. The Russell 2000 Index is a subset of the Russell 3000® Index representing approximately 10% of the total market capitalization of that index. It includes approximately 2,000 of the smallest securities based on a combination of their market cap and current index membership. The Dow Jones Industrial Average® is a price-weighted measure of 30 U.S. blue-chip companies. The Index covers all industries except transportation and utilities. The NASDAQ Composite Index measures all NASDAQ domestic and international based common type stocks listed on The NASDAQ Stock Market. The NASDAQ Composite includes over 3,000 companies, more than most other stock market indexes. The Bloomberg U.S. Aggregate Bond Index is an unmanaged index of domestic investment grade bonds, including corporate, government and mortgage-backed securities. The WTI Crude Oil Index is a major trading classification of sweet light crude oil that serves as a major benchmark price for oil consumed in the United States. The Brent Crude Oil Index is a major trading classification of sweet light crude oil that serves as a major benchmark price for purchases of oil worldwide. The 3-Month U.S. Treasury Bill is a short-term debt obligation backed by the U.S. Treasury Department with a maturity of three months. Consumer Price Index is a measure of the average change over time in the prices paid by urban consumers for a market basket of consumer goods and services. The volatility (beta) of the Composite may be greater or less than its respective benchmarks. It is not possible to invest directly in these indexes.
Original Post
Editor’s Note: The summary bullets for this article were chosen by Seeking Alpha editors.


