

studiocasper
Part I – Introduction
Agnico Eagle (NYSE:AEM) is part of my preferred long-term gold miners I have covered quarterly on Seeking Alpha since 2014. The company reported its second-quarter 2022 results on July 28, 2022.
AEM Assets Map Presentation (Agnico Eagle Mines)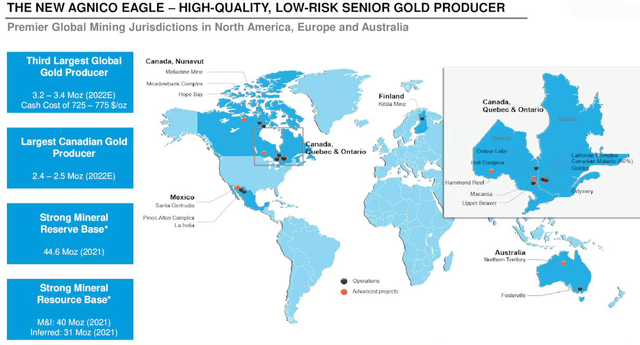
Note: This is a quarterly update from my preceding article published on June 6, 2022.
1 – 2Q22 results snapshot
Note: On February 8, 2022, Agnico Eagle and Kirkland Lake Gold announced the completion of the merger of equals transaction.
The second quarter of 2022 is the first full production quarter post-merger. The new AEM is now a more significant entity with larger gold production.
However, the outstanding shares diluted increased in 2Q22 from 385.59 million to 456.79 million.
AEM 2Q22 (Agnico Eagle Mines)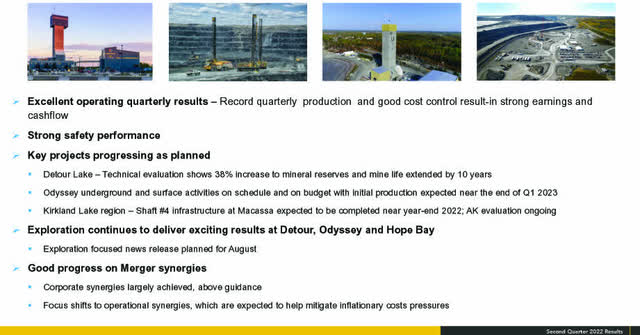
Agnico Eagle reported a net income of $275.85 million or $0.60 per diluted share in the second quarter of 2022, compared with $196.39 million or $0.80 per diluted share reported last year. The adjusted net income of $235.6 million or $0.61 per share for the first quarter of 2022.
The adjusted earnings per share came in at $0.75 per share. The company generated revenues of $1,581.06 million this quarter, above the $1,325.69 million generated in 1Q22.
Production in the second quarter of 2022 was 858,170 Au ounces, 588K Ag ounces, 2,568 MT of Zinc, and 778 MT of Copper.
Ammar Al-Joundi, the new CEO, said in the conference call:
the real story of the past quarter, and I think the real story for Agnico Eagle over the next several years is the exciting and significant progress on our development projects and our exploration results. And I say that because while we are performing on all cylinders on the operations, our development projects and exploration results really reflect the future of the Company, the next 5 years, the next 10 years.
2 – Stock performance
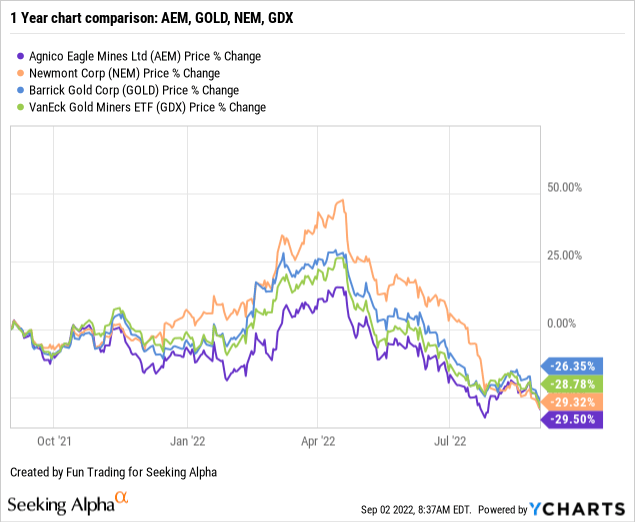
Agnico Eagle, Newmont (NEM), and Barrick Gold (GOLD) are my preferred long gold miners.
As shown below, AEM is down 29.5% on a one-year basis and has slightly underperformed most of its peers. The effect of the recent merger with Kirkland Lake Gold on February 8, 2022 has been neutral, as I had expected.
The chart below shows a significant selloff since May due to the Fed’s action against rampant inflation.
A quick look at Agnico Eagle’s production in 2Q22 shows a solid quarter helped by a full quarter of Kirkland Lake Gold.
Still, comparing it to the preceding quarters isn’t easy because Agnico Eagle has added three more producing mines from Kirkland Lake Gold. A reminder, in 1Q22, production from Kirkland Lake represented only 53 days.
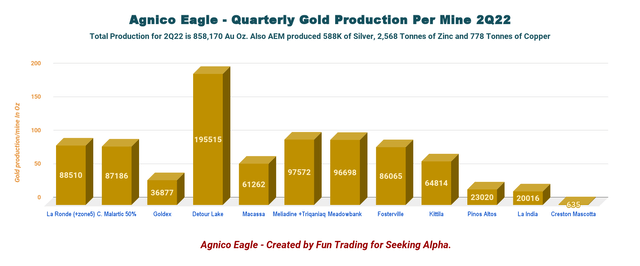
Agnico Eagle presently produces gold from 12 mines with details below:
AEM Quarterly Gold Production per mine 1Q22 versus 2Q22 (Fun Trading)
Detour Lake, Macassa, and Fosterville mines are included in the chart above and represent the total quarter production. Agnico performed very well sequentially with a massive increase in Detour Lake.
The project pipeline is vital, especially with Detour Lake, Odyssey, and Hope Bay.
AEM Projects (Agnico Eagle Mines Presentation)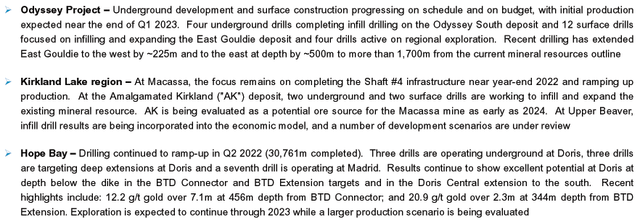
3 – Investment thesis
Agnico Eagle presents a solid financial profile that suits the fundamental requirements of a savvy investor’s balanced portfolio.
Nothing has changed at this level, even if the company has grown in size after the Kirkland Lake Gold acquisition.
The new company is generating a free cash flow of $224.67 million in 2Q22 and pays a secure and attractive dividend with a yield of 3.98%.
However, the stock performance has been constantly below expectations, and the recent merger with Kirkland Lake has not changed the trend despite a stronger balance sheet.
As I said, bigger is not necessarily better. The gold price is weak and has dropped significantly since the Fed hiked the interest rates twice by 75 points. Jerome Powell, the Fed’s chairman, recently announced that it would be another increase in September and potentially more later, raising the prospect of a painful recession.
Thus, as I have said in my preceding articles, I recommend accumulating AEM on any weakness for the long term. However, I am not expecting a solid uptrend unless gold turns extremely bullish and can cross $1,800 per ounce again, and it is not likely for the next few weeks.
Thus, trading short-term LIFO at a minimum of 30%-35% of your AEM position is crucial.
Agnico Eagle – Financials and Production in 2Q22 – The Raw Numbers
| Agnico Eagle | 2Q21 | 3Q21 | 4Q21 | 1Q22 | 2Q22 |
| Total Revenues in $ Million | 966.3 | 974.1 | 949.1 | 1,325.7 | 1,581.1 |
| Net Income in $ Million | 189.6 | 114.8 | 101.1 | 109.8 | 275.9 |
| EBITDA $ Million | 480.8 | 415.6 | 388.4 | 458.0 | 747.7 |
| EPS diluted in $/share | 0.77 | 0.47 | 0.41 | 0.28 | 0.60 |
| Cash from operations in $ Million | 406.9 | 291.0 | 261.7 | 507.4 | 633.3 |
| Capital Expenditure in $ Million | 204.3 | 244.6 | 236.9 | 293.2 | 408.6 |
| Free Cash Flow in $ Million | 202.6 | 46.4 | 24.8 | 214.3 | 224.7 |
| Total cash $ Billion (including equity securities) | 0.28 | 0.24 | 0.19 | 1.06 | 1.02 |
| Total debt in $ Billion | 1.57 | 1.57 | 1.57 | 1.57 | 1.44 |
| Dividends per quarter in $/ share | 0.35 | 0.35 | 0.40 | 0.40 | 0.40 |
| Shares outstanding diluted in millions | 244.8 | 244.9 | 245.5 | 385.6 | 456.8 |
Source: Company filing and Fun trading.
Part II – Gold Production Details
1 – Gold production
Agnico Eagle had gold production this quarter. Production was 858,170 Au Oz from 660,604 Au ounces the preceding quarter. The company produced 858.17K Ag ounces, 588K Ag Oz, 2,568 Zinc, and 778 Tonnes of Copper.
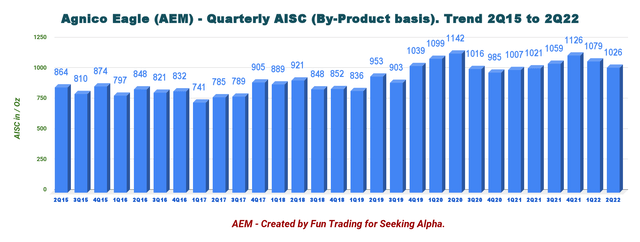
AEM Quarterly Gold Production history (Fun Trading) The new AEM included three new producing mines (Detour, Fosterville, and Macassa). The 2Q22 is the first full quarter of production combining Agnico Eagle and Kirkland Lake Gold. AEM Quarterly Gold production per mine history (Fun Trading) All-in sustainable costs, or AISC, were an average of $1,026 per ounce in 2Q22 compared to $1,021 in the prior-year period. I was expecting a much lower AISC with the merger, but inflationary pressures did not help. AEM Quarterly AISC history (Fun Trading) AEM Highlights (Agnico Eagle Mines)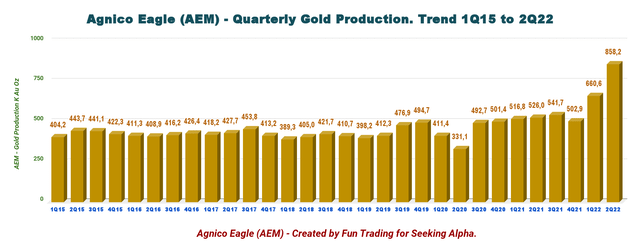
1.1 – Presentation highlights for the second quarter:
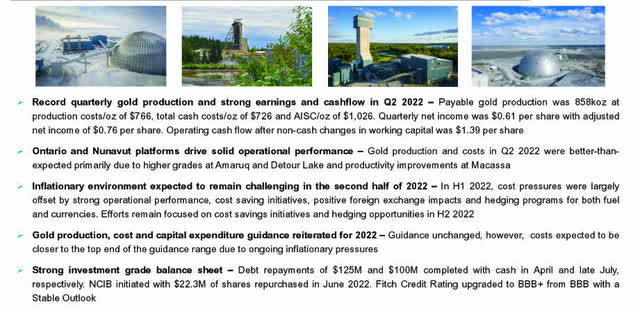
2 – Guidance for 2022 unchanged
The company remains unchanged from the previous quarter, with payable gold production for 2022 in the 3.2-3.4 Moz range.
It also projects total cash costs per ounce of $725-$775 and AISC of $1,000-$1,050 per ounce for 2022.
The forecast for 2022 CapEx is set at roughly $1.4 billion. The 2022 depreciation and amortization expense guidance remain unchanged (between $1.37 to $1.47 billion for the full year 2022).
Part III – Balance Sheet Analysis
1 – Revenues of $1,581.1 million in 2Q22
Revenues were $1,325.69 million, up 39.6% compared to the same quarter a year ago and up 39.7% quarter over quarter.
The company posted a $109.75 million net income, or $0.28 per diluted share, in the first quarter of 2022.
AEM Quarterly revenues history (Fun Trading)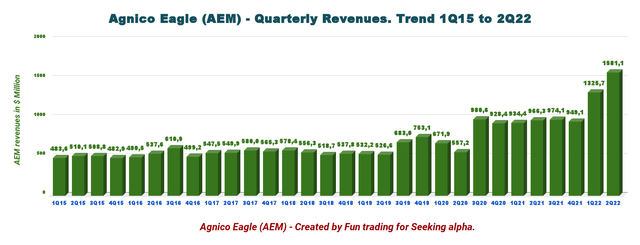
2Q22 Total Operating Margin was $923 million.
AEM Quarterly Gold Price history (Fun Trading)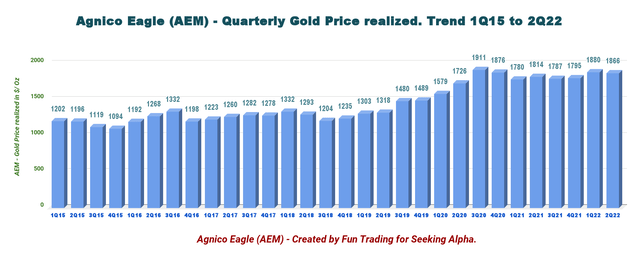
2 – Free cash flow was $224.7 million in 2Q22
Trailing 12-month free cash flow was $510.15 million (“TTM”), and the free cash flow for 2Q22 was $224.67 million.
AEM Quarterly Free cash flow history (Fun Trading)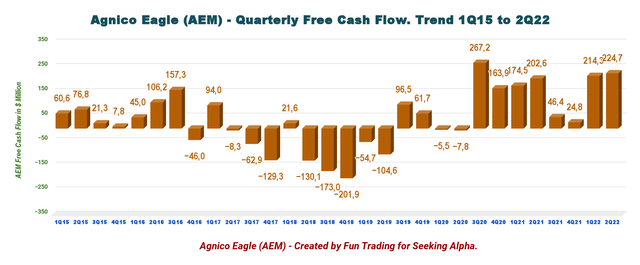
Free cash flow generation is expected to be strong in the next few quarters, and the company declared a quarterly dividend of $0.40 per share, or about a 4% yield.
A share buyback with the ability to purchase up to $500 million of common shares (to a maximum of 5% of issued and outstanding common shares) began in June 2022. In 2Q22, $22.3 million of shares were repurchased.
It will help reduce the diluted outstanding shares, which went up from 245.51 million in 4Q21 to 456.79 million in 2Q22, an increase of 86.06% (please see table above).
3 – Net debt was $0.425 billion in 2Q22
Agnico Eagle has solid financials with a low net debt of $425 million, up sequentially from $502 million.
Agnico Eagle’s debt profile is what we want to see for a long-term investment.
AEM Quarterly Cash versus Debt history (Fun Trading)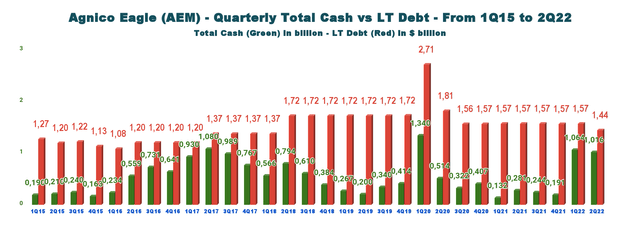
Agnico Eagle had total cash of $1,016.27 million in 2Q22 compared with $191.07 million as of December 31, 2021. Long-term debt was around $1,441.2 million, compared with $1,566.48 million in 2Q21.
Note: after the quarter, an additional $100 million of debt maturing on July 24, 2022, was repaid with cash.
As of June 30, 2022, the company had strong liquidity of $2.2 billion, including $1.2 billion (excluding a $600 million accordion) in undrawn credit lines.
4 – 2021 Reserves (Proven and Probable) – Total AEM and KL are 44.733 Moz. (unchanged from the preceding quarter)
AEM Reserves (Presentation Agnico Eagle)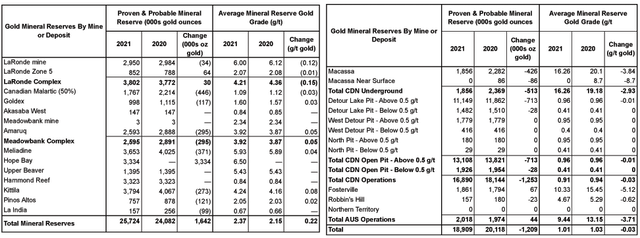
Part IV – Technical Analysis and Commentary
AEM TA Chart Short-term (Fun Trading StockCharts)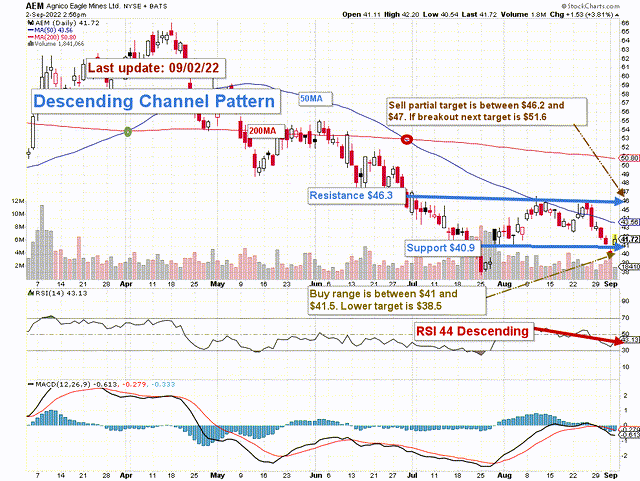
Note: The chart has been adjusted for dividends.
AEM forms a descending channel pattern with resistance at $46.3 and support at $40.9, with a mid-pattern support/resistance at $43.6 (50MA), which should be used as an intermediary resistance in this case.
A descending channel is considered a reversal or a continuation pattern, depending on how the chart enters the channel. In this case, it may be bearish as a continuation pattern, but it is ambiguous.
The trading strategy I recommend is to sell about 30% between $46.2 and $47 with a potential upper resistance at $50-$51 (200MA). On the other side, I recommend buying between $41 and $41.5, with possible lower support at $38.5.
AEM has dropped precipitously starting in April and is now trading in a narrow channel. However, the Fed has turned more hawkish since April with a couple of 75-point hikes and a definite hike in September. In this case, the gold price will likely turn bearish and may drop below $1,700 per ounce, even if I believe that $1,700 per ounce is solid support.
I expect the miners to experience frequent wild swings for the next several months. Thus, it is crucial to allocate a sizeable portion of your investment in AEM to trade short-term LIFO and take advantage of the volatility. About 30%-35% is reasonable.
Note: The LIFO method is prohibited under International Financial Reporting Standards (IFRS), though it is permitted in the United States by Generally Accepted Accounting Principles (GAAP). Therefore, only US traders can apply this method. Those who cannot trade LIFO can use an alternative by setting two different accounts for the same stock, one for the long term and one for short-term trading.
Warning: The TA chart must be updated frequently to be relevant. It is what I am doing in my stock tracker. The chart above has a possible validity of about a week. Remember, the TA chart is a tool only to help you adopt the right strategy. It is not a way to foresee the future. No one and nothing can.
Author’s note: If you find value in this article and would like to encourage such continued efforts, please click the “Like” button below as a vote of support. Thanks.


")


