designer491
The Virtus Diversified Income & Convertible Fund (NYSE:ACV) aims to deliver current income and capital appreciation from a diversified portfolio of convertible and hybrid securities.
During bull markets, convertible securities can deliver equity-like returns due to their embedded options. ACV’s 5Yr average annual total return of 9.6% suggest its high distribution rate, currently set at $0.18 / month or 10.3% market yield, is sustainable.
However, investors should be mindful that ACV’s short historical returns includes the extraordinary 2020/2021 period that was turbocharged by Fed largess. If future returns go back to historical ranges, then the fund’s 2021 decision to increase its distribution rate may prove to be unwise.
Fund Overview
The Virtus Diversified Income & Convertible Fund is a closed-end fund (“CEF”) that seeks to provide current income and capital appreciation. The fund primarily invests in a diversified portfolio of convertible securities, income-producing equities, and income producing debt securities. At least 50% of total managed assets are invested in convertibles.
The ACV fund may also write covered calls to generate income, and employ leverage to enhance returns.
The ACV fund was formerly called The Virtus AllianzGI Income & Convertible Fund (and is still referred to as such on Seeking Alpha), but changed its name on June 22, 2022 to reflect the removal of Allianz Global Investors as the fund sub-advisor.
The ACV has a fixed 15-year term from the effective date of the fund’s registration, meaning the fund will be liquidated in 2030, unless shareholders vote to extend the fund’s term.
The ACV fund has $205 million in net assets and $105 million in leverage ($30 million in preferred shares and $75 million in debt), making ACV fairly levered (Figure 1). The fund charged 2.55% in total expenses for the fiscal year ended January 31, 2022.
Figure 1 – ACV has high levels of leverage (virtus.com)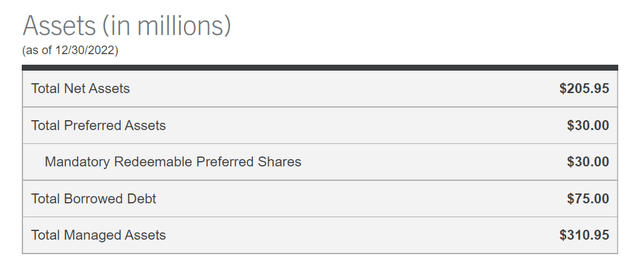
What Are Convertible Securities?
Convertible securities are investments that can change from its initial form into another form after certain conditions are met. The most common types of convertible securities are convertible bonds and convertible preferred shares that can be converted into common stock at given conversion price.
Compared to traditional bonds, convertible bonds typically carry lower interest rates. This is because the ‘option’ to convert into common stock is valuable. For the issuer, this allows them to raise capital at a lower fixed carrying cost than traditional bonds, although the tradeoff is potential share dilution. For investors, they are willing to accept a lower interest coupon, because they can participate in the ‘equity upside’ if the company does well.
One way to think about convertible bonds is to consider them as a combination of a traditional bond plus a call option on the underlying stock. Typically in a bull market, when stocks do well, convertible bonds can perform exceptionally well compared to other fixed income investments as the option component provides upside convexity. For example, if the reference stock price rallies beyond the conversion price, the convertible bond can begin to trade like the stock due to the embedded option. Conversely, in a bear market, convertible bonds can perform very poorly, as the option component can lose value very quickly.
Portfolio Holdings
Figure 2 shows ACV’s asset class allocation. As described above, the ACV fund has 61% invested in convertible securities, 23% in common equities, and 14% in high yield bonds.
Figure 2 – ACV asset allocation (virtus.com)
Figure 3 shows the fund’s credit quality breakdown. Convertible securities and equities are mostly unrated assets. Of the rated assets, 7% is investment grade (“IG”) and 19% is non-investment grade (“junk”).
Figure 3 – ACV credit quality allocation (virtus.com)
Returns
Figure 4 shows the ACV fund’s historical returns. Returns have been fairly strong, with 3 and 5Yr average annual total returns of 7.2% and 9.6% respectively to December 31, 2022. This is despite poor 2022 returns of -28.0%.
Figure 4 – ACV historical returns (morningstar.com)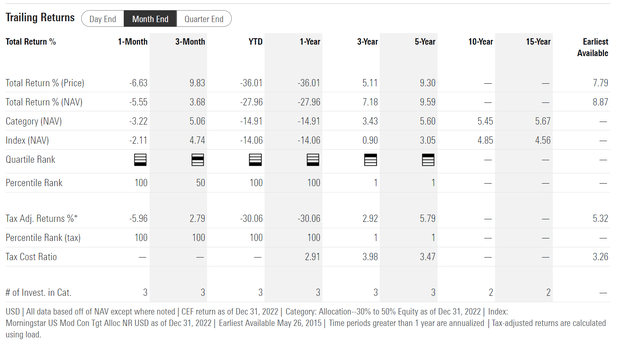
Looking at the ACV’s returns on an annual basis, we can see that prior to 2022, the fund had done very well, with a minimum return of -3.7% in 2018 and a maximum of 53.6% in 2020 (Figure 5).
Figure 5 – ACV annual returns (morningstar.com)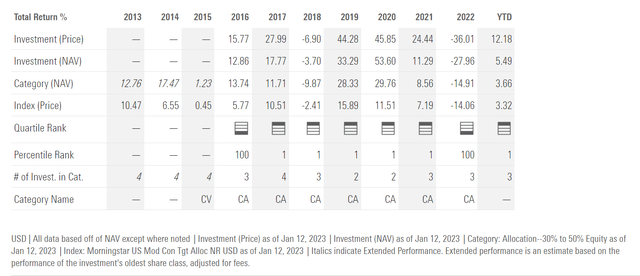
This is reflective of the nature of convertible securities’ returns, as explained above. During bull markets, many convertible bonds have reference stock prices trading far above conversion price, hence convertible bonds were delivering equity-like returns during the longest bull market in history. Figure 6 shows the annual returns of SPDR S&P 500 Trust ETF (SPY) for reference.
Figure 6 – SPY annual returns (morningstar.com)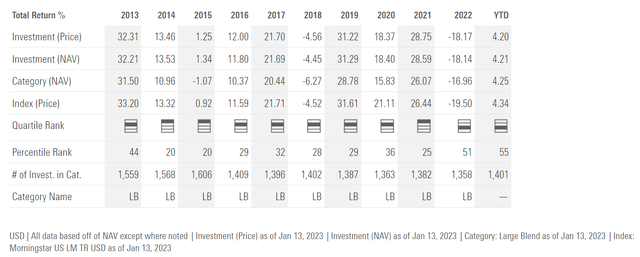
Distribution & Yield
The ACV fund pays a monthly distribution of $0.18 / share, which annualizes to 10.3% current yield on market price or 10.2% on NAV.
Note, the trailing payout information on Seeking Alpha is a little misleading, as it includes a $5.80 special distribution that was paid in December 2021 to satisfy federal tax requirements (Figure 7). For 2022, a $0.196 / share special distribution was recently announced.
Figure 7 – ACV training 12 month distribution is a little misleading (Seeking Alpha)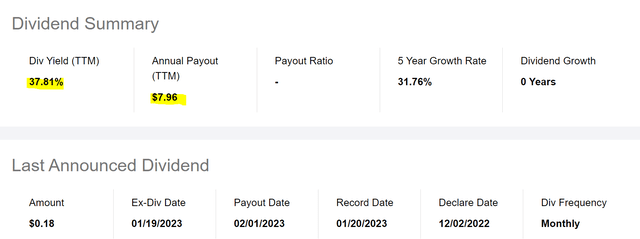
The ACV fund adopted a ‘managed distribution plan’ in December 2021, agreeing to pay distributions at a monthly rate of $0.18 / share. At inception of the managed distribution plan, ACV’s distribution rate was an annualized 6.3% on its then market price. However, due to the fund’s negative performance in 2022, the fixed distribution rate is now annualizing at over 10%.
Investors should also note that in the current fiscal year, ACV has funded its distribution mostly from short-term and long-term realized capital gains, which have combined for 99.8% of the distribution (Figure 8).
Figure 8 – ACV distribution funded from capital gains (ACV January 2023 19a notice)
Some investors may question the sustainability of ACV’s distribution, since it earns little in the form of net investment income (“NII”). However, I prefer to look at a fund’s long-term average annual total returns versus the distribution rate to assess whether a distribution is sustainable. For investors, it really should not matter whether a distribution is funded from capital gains or investment income (except for tax considerations), as long as paying the distribution does not strain the fund’s resources.
Funds that pay high distributions but have declining NAV are called ‘return of principal’ funds. Their distribution rates are greater than their returns, so these funds must use investors’ own principal to fund distributions. In the long run, ‘return of principal’ funds have distributions that are unsustainable because the earnings shortfall creates a negative spiral where NAV shrinks over time, leading to less income earning assets to support the distribution rate, which leads to further NAV declines.
Using the NAV yardstick, we can see ACV’s NAV is roughly at the same level it was back in 2016, so ACV does not have a structurally declining NAV (Figure 9). This suggests that over the long-run, ACV has earned its distribution, even if it delivered an exceptionally poor -28.0% return in 2022.
Figure 9 – ACV historical NAV (morningstar.com)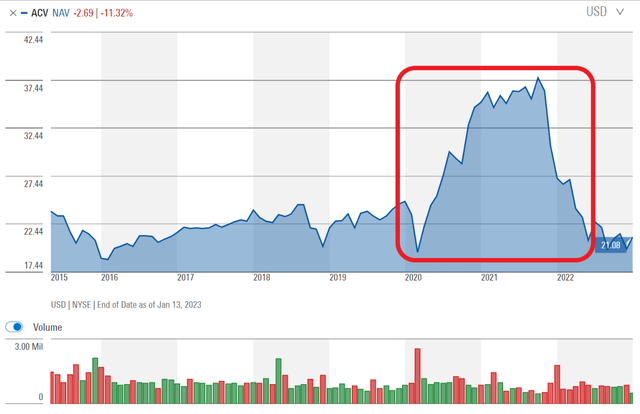
Another interesting observation one can make from looking at ACV’s historical NAV is to recognize how unusual the 2020/2021 period was. If readers can recall, 2020 was marked by the COVID-19 pandemic and the Fed’s emergency response. Essentially, the Fed opened the monetary spigots and flooded the world with cheap money in order to prevent an economic collapse. This liquidity largess turbocharged equity market returns. Given convertible securities’ convex nature (remember they can be modelled as bonds plus stock call options), ACV’s returns were likewise turbocharged in 2020.
In other periods, ACV’s NAV was mostly flat to sideways, indicating that the fund’s strategy earned its distribution, but not much more. If we think of ACV in that context, then the fund’s 2021 decision to increase its monthly distribution rate from $0.167 to $0.18 may have been unwise, as it was probably influenced by recency bias (Figure 10).
Figure 10 – ACV increased its distribution by 8% in 2021 (Seeking Alpha)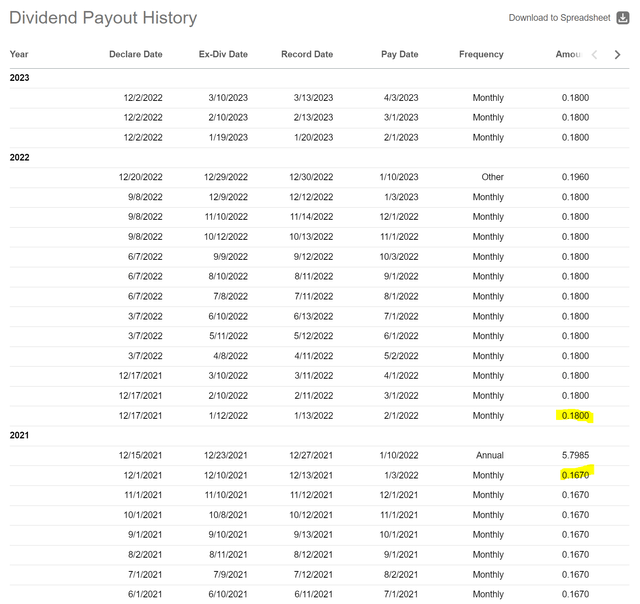
If ACV’s future returns go back to historical ranges, then the current $0.18 / month distribution rate may ultimately prove to be unsustainable and will need to be adjusted lower. Time will tell whether this is the case.
Conclusion
In summary, the ACV fund is a CEF that aims to deliver current income and capital appreciation from a diversified portfolio of convertible and hybrid securities. During bull markets, convertible securities can deliver equity-like returns due to their embedded options.
ACV’s current distribution yield of 10.3% appears sustainable, given the fund has a 5Yr average annual total return of 9.6%. However, investors need to keep in mind that ACV’s historical returns include the extraordinary 2020/2021 period that was turbocharged by Fed largess. If future returns go back to historical ranges, then the fund’s 2021 decision to increase its distribution rate may prove to be unwise.


