Index Investing News
Monday, May 26, 2025
No Result
View All Result
  • Login
  • Home
  • World
  • Investing
  • Financial
  • Economy
  • Markets
  • Stocks
  • Crypto
  • Property
  • Sport
  • Entertainment
  • Opinion
  • Home
  • World
  • Investing
  • Financial
  • Economy
  • Markets
  • Stocks
  • Crypto
  • Property
  • Sport
  • Entertainment
  • Opinion
No Result
View All Result
Index Investing News
No Result
View All Result

A Technical View Of Potential Downside For The Market

by Index Investing News
January 11, 2024
in Stocks
Reading Time: 5 mins read
A A
0
Home Stocks
Share on FacebookShare on Twitter


StockGood

Stocks continued to rebound yesterday to the extent that the S&P 500 recovered all of last week’s losses and now sits just 0.3% from a new all-time high. The sector leadership so far this year is an unusual mix with healthcare leading the pack, followed by communications services, as growth and value battling for the lead in an overall improving environment for market breadth. While I have been anticipating new all-time highs for some time, I was also expecting a pullback or period of consolidation in advance of that new high as we began the new year. I am not confident that the 2% drawdown over the first four days of trading will do the trick. Therefore, I am reviewing some of the technical indicators I use, both short and long term, to conclude what the potential downside might be from here for the broad market.

market averages

Finviz

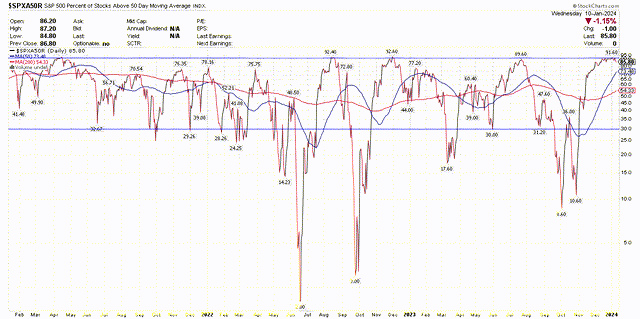
One of my favorite short-term indicators is the percentage of stocks trading above their 50-day moving average for a particular index. With respect to the S&P 500, the percentage tends to peak at 90% and bottom around 30%. There are several extreme cases where the percentage has fallen to single digits, which have clearly been meaningful buying opportunities. After peaking at 91.6% just days ago, we sit at 85.8%, which has hardly resolved the overbought condition that existed in late December. In fact, every time the percentage has risen above 70% over the past three years there has been a subsequent decline to at least 30%. Something like this has happened within just a few weeks.

% above 50 day

Stockcharts

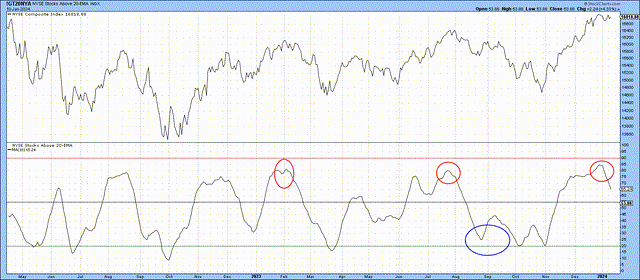
I like to couple this indicator with the percentage of stocks on the New York Stock Exchange (approximately 2,400) that are trading above their 20-day exponential moving average (EMA). In a similar fashion, this indicator peaks close to 90% and bottoms around 20%. It was this indicator that gave me pause last year in both late February and July, as I noted concern that we may see a pullback or period of consolidation in the major market indexes. I was early in calling for an end to the fall correction, as this indicator approached 20% but did not pierce it. That did not happen until early October, but the fact that we remained in a bull market uptrend bailed me out of that early call.

% above 20 day EMA

Stockcharts

Today, note that we have made some meaningful progress in bringing this percentage down to its mean, but there is further to go at approximately 65% before this indicator screams short-term buying opportunity.

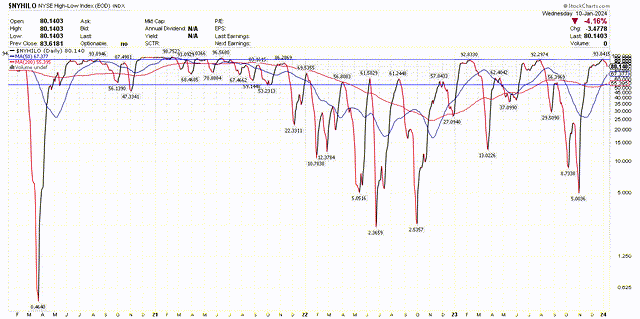
I also follow the New York Stock Exchange High-Low Index, which calculates the percentage of stocks reaching new 52-week highs relative to the total number of new highs plus new lows. It is a breadth indicator that is its most useful at extremes. Its recent high of 93.8% was an extreme, but it has now fallen to 80%. Even if breadth remains strong, a level closer to 60-70% would indicate a healthy pullback.

hi-low index

Stockcharts

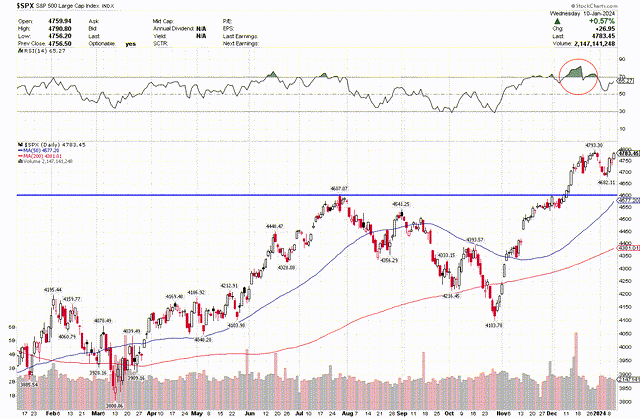
How do these indicators impact the S&P 500? It seems probable that we will see lower levels in the weeks ahead if these short-term technical indicators revert to their means. The Relative Strength Index (RSI) for the S&P 500 resolved its extremely overbought condition from mid-December (top of chart) by the benchmark simply consolidating over the past three weeks. Yet I think we can see a test of the 50-day moving average at approximately 4,600 before we set the stage for another significant advance. That would be a relatively mild 4% drawdown from the recent high. Of course, we could see a larger pullback, depending on the incoming economic data.

S&P 500

Stockcharts

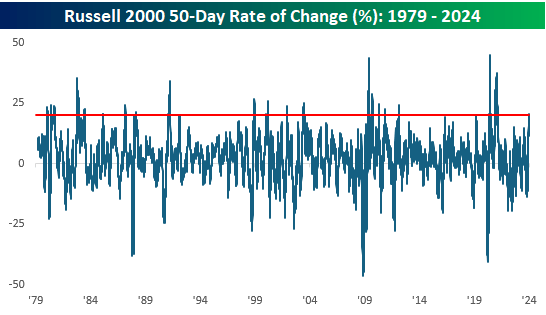
All this said, I remain firmly in the bull camp from a fundamental perspective, which is why the following statistic was music to my ears for the longer term uptrend. Yesterday, Bespoke Investment Group noted that it had been 50 trading days since the correction low last October 27, during which the Russell 2000 index rallied more than 20%. That was only the 21st time such a rally has occurred over a rolling 50-day period since 1979.

rolling 50 day returns

Bespoke

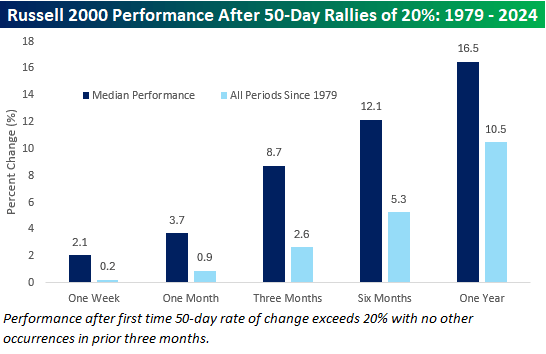
The forward returns after such a large move upward for the index are impressive. In fact, the median gain has outperformed over the following week, month, three-month, six-month, and one-year periods.

Russell 2000 index returns

Bespoke

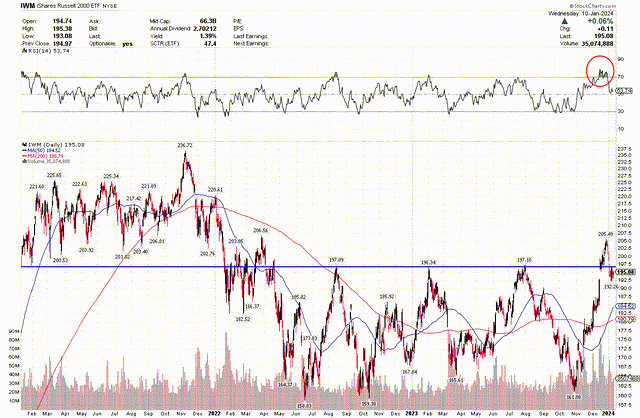
The Russell 2000 index has pulled back 5% from a major breakout that followed a long period of consolidation over the past two years. This index is far from overbought and poised for a move higher, based on the technical. It is far more volatile than the S&P 500 and could see a further decline to its long-term moving average, but I think that would set the stage for a more pronounced advance to a new 52-week high.

Russell 2000 index

Stockcharts

I love to come across statistics like this when they reaffirm my fundamental outlook for the economy (soft landing) and market (bullish). I still need to respect the short-term condition, which remains extended to the upside. That is why I started the year leaning modestly defensive with the hopes of putting dry powder to work on pullback during the early part of this year.


Source link

Tags: downsidemarketpotentialTechnicalView
ShareTweetShareShare
Previous Post

Candice Carty-Williams On Adapting ‘Queenie’ & Netflix’s ‘Champion’ – Deadline

Next Post

Spot Ethereum ETF May See Green Light in May

Related Posts

THW: Revenue Traders Probably To Face A Large Distribution Minimize

THW: Revenue Traders Probably To Face A Large Distribution Minimize

by Index Investing News
May 25, 2025
0

This text was written byObserveTrapping Worth is a crew of analysts with over 40 years of mixed expertise producing choices...

LRGF: Low-Charge Issue ETF With Convincing Efficiency Is A Purchase (NYSEARCA:LRGF)

LRGF: Low-Charge Issue ETF With Convincing Efficiency Is A Purchase (NYSEARCA:LRGF)

by Index Investing News
May 25, 2025
0

This text was written byObserveVasily Zyryanov is a person investor and author.He makes use of numerous methods to seek out...

TreeHouse Meals: Effectivity Beneficial properties Priced In, Truthful Valuation Helps Maintain (NYSE:THS)

TreeHouse Meals: Effectivity Beneficial properties Priced In, Truthful Valuation Helps Maintain (NYSE:THS)

by Index Investing News
May 24, 2025
0

This text was written byObserveI'm an enthusiastic fairness analysis and funding analyst with a powerful curiosity in making use of...

Seagate Know-how Holdings plc (STX) Seagate 2025 Investor and Analyst Convention – (Transcript)

Seagate Know-how Holdings plc (STX) Seagate 2025 Investor and Analyst Convention – (Transcript)

by Index Investing News
May 23, 2025
0

Seagate Know-how Holdings plc (NASDAQ:STX) Seagate 2025 Investor and Analyst Convention Name Could 22, 2025 9:00 AM ET Firm Members...

2 BDCs That Qualify For The Retirement Earnings League

2 BDCs That Qualify For The Retirement Earnings League

by Index Investing News
May 23, 2025
0

This text was written byObserveRoberts Berzins has over a decade of expertise within the monetary administration serving to top-tier corporates...

Next Post
Spot Ethereum ETF May See Green Light in May

Spot Ethereum ETF May See Green Light in May

Why Manchester City are being sued by Superdry

Why Manchester City are being sued by Superdry

Leave a Reply Cancel reply

Your email address will not be published. Required fields are marked *

RECOMMENDED

Just Listed | 21370 Sweetwater Lane N

Just Listed | 21370 Sweetwater Lane N

August 13, 2023
10 Tuesday AM Reads – The Massive Image

10 Tuesday AM Reads – The Massive Image

March 22, 2022
The British Betrayal of an Afghan Special Police Commando Force

The British Betrayal of an Afghan Special Police Commando Force

September 2, 2023
Full Trailer for ‘Say Nothing’ Collection Set Throughout Eire’s The Troubles

Full Trailer for ‘Say Nothing’ Collection Set Throughout Eire’s The Troubles

October 25, 2024
Buyers are Dominating Market, TAMA Explodes Skywards

Buyers are Dominating Market, TAMA Explodes Skywards

September 12, 2022
Top 10 Recession Proof Stocks for 2022-2023

Top 10 Recession Proof Stocks for 2022-2023

September 17, 2022
B3 S.A. – Brasil, Bolsa, Balcão (BOLSY) Q1 2025 Earnings Name Transcript

B3 S.A. – Brasil, Bolsa, Balcão (BOLSY) Q1 2025 Earnings Name Transcript

May 9, 2025
Better Inflation Forecasters: Economists or Consumers?

Better Inflation Forecasters: Economists or Consumers?

November 16, 2023
Index Investing News

Get the latest news and follow the coverage of Investing, World News, Stocks, Market Analysis, Business & Financial News, and more from the top trusted sources.

  • 1717575246.7
  • Browse the latest news about investing and more
  • Contact us
  • Cookie Privacy Policy
  • Disclaimer
  • DMCA
  • Privacy Policy
  • Terms and Conditions
  • xtw18387b488

Copyright © 2022 - Index Investing News.
Index Investing News is not responsible for the content of external sites.

No Result
View All Result
  • Home
  • World
  • Investing
  • Financial
  • Economy
  • Markets
  • Stocks
  • Crypto
  • Property
  • Sport
  • Entertainment
  • Opinion

Copyright © 2022 - Index Investing News.
Index Investing News is not responsible for the content of external sites.

Welcome Back!

Login to your account below

Forgotten Password?

Retrieve your password

Please enter your username or email address to reset your password.

Log In