Michael M. Santiago
Meta Platforms (NASDAQ:META), formerly known as Facebook, is the largest social media company in the world (outside of China). Meta has been dominant in the advertising business and was pretty much untouchable for over a decade. The company benefited massively from the lockdown of 2020, which caused an acceleration in those using digital technology and social media. However, since September 2021, its stock price has been butchered by over 63% due to a combination of slowing user growth and monetization issues with its new “Reels” feature. In addition, its name change to “Meta” from Facebook in October 2021 spooked Wall Street as they were cautious about the “billions of dollars” which are to be invested in an unproven concept, namely the “Metaverse”. Despite this tepid backdrop, Meta is still in a solid leadership position and has a high-quality business. Its stock price is also deeply undervalued and the technical chart looks positive. In this post, I’m going to break down its technical chart before revisiting its financials and my valuation model. Let’s dive in.
Technical Analysis
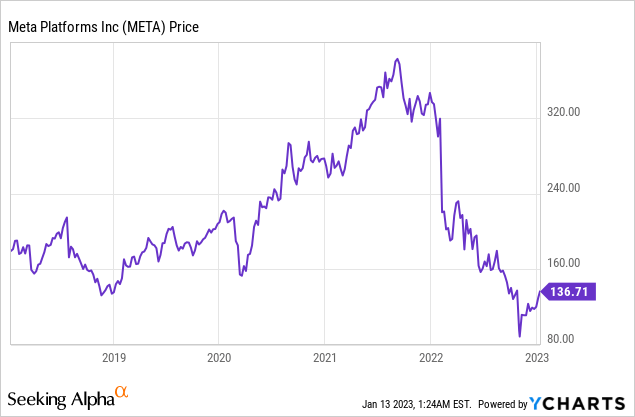
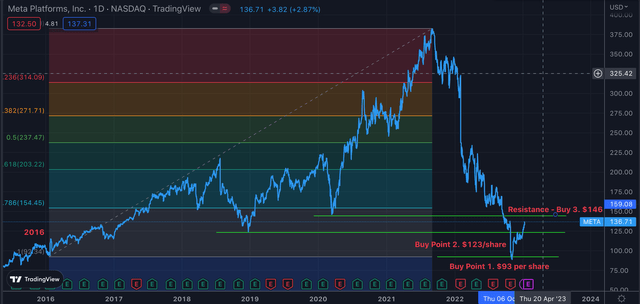
Generally, I invest in stocks using fundamental analysis. However, technicals are still useful to identify possible entry or “buy points”. These various indicators can help show where investors have seen value in a stock previously. The below graphic shows Meta’s stock price as the blue line which you can see has plummeted below its 2020 low ($146/share)(“Buy point 3”) and slightly above its 2019 low ($123/share) (“Buy point 2”).
Previously the stock price had plummeted to its 2016 low of $93 per share, (“buy point 1”). The “Buy points” I have laid out, identify previous support lines where investors in Meta have seen value historically. The colored box area is a Fibonacci retracement indicator which helps to further identify support and resistance lines. Fibonacci numbers are a special series found in nature that occurs in everything from the creation of a snail’s shell to human physiology.
Meta Technicals (Created by author Deep Tech Insights)
Here is a quick summary on the chart, Meta’s stock plummeted below its 2020 and 2019 low. However, the stock price bounced strongly of its 2016 low (Buy Point 1. $93 per share) and then broke through the “Buy Point 2” resistance line, which has now developed into a “support” line. Therefore, if Meta’s stock price pulls back from its ~$136 per share mark, it is likely to drop to ~$123/share (buy point 2) as it shows strong support.
In order to move higher, Meta will need to break through a resistance line (“Buy point 3”), at ~$146 per share. Therefore it would make sense to watch for this breakthrough, which indicates the stock could blast higher. Of course, technical analysis is not an exact science. However, it is used by legendary billionaire investors such as Paul Tudor Jones who made over $1 billion in 24 hours, shorting the pound along with George Soros. In the case of Meta, a “catalyst” such as strong earnings or a positive news report could help to spur on investors and enable the share price to break through the resistance (Buy point 3).
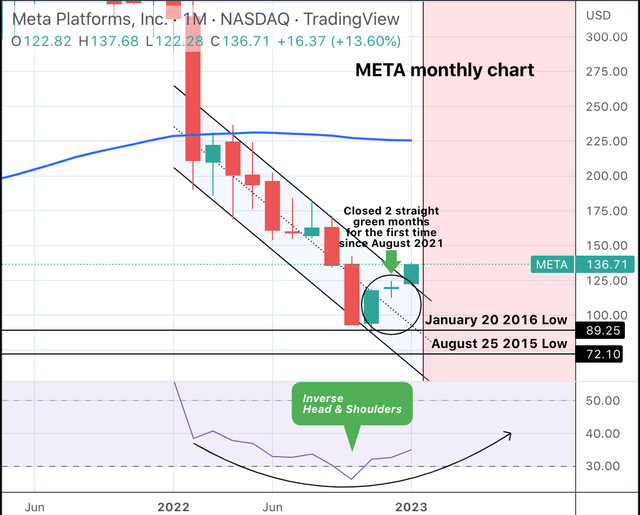
If we review the “candlestick” chart (below) for Meta’s share price, we can see its share price has closed green for two consecutive months, which is the first time this has occurred since August 2021. There is also an “inverse head and shoulder” pattern which indicates buying momentum.
Meta stock technicals 2 (TradingShot)
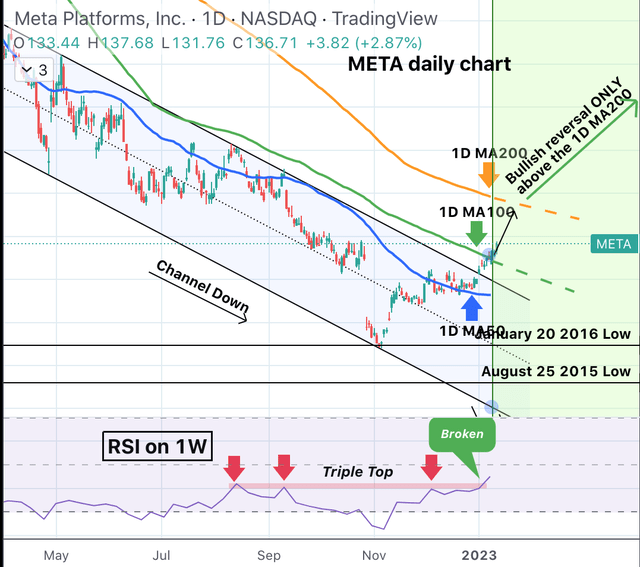
Diving into chart three below (at the bottom), more detail is shown on the “inverse head and shoulder” pattern or “triple top” which has had its resistance line broken. On the main chart below Meta is trading above its 50-day moving average and has broken through its 100-day moving average which is positive. Similar to the first chart, if Meta can break through its 200-day moving average it is likely to continue to move higher in a “bullish reversal”.
Meta Technicals 3 (TradingShot)
Financial Recap
In previous posts on Meta, I have covered its financials in granular detail and broke down its huge investments into the “Metaverse”, here is a quick recap.
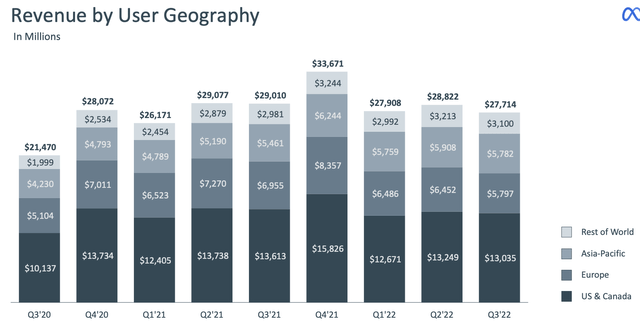
In the third quarter of 2022, Meta generated $27.7 billion in revenue which declined by 4% year over year, despite beating analyst expectations by $313.82 million. The good news is this decline was mainly caused by foreign exchange headwinds, from the strong U.S. dollar which impacted international revenue. On an FX-neutral basis, its revenue actually rose by 2% year over year or an extra $1.79 billion.
The “recessionary” environment means we are going through a downturn in the advertising market, which impacts Meta’s core business. A positive with this is advertising spend tends to be cyclical with the economy, thus a rebound would be expected long term. Specifically for Meta, the company is facing challenges after the Apple iOS update, which enables users to “opt out” of tracking on platforms such as Instagram. As this is a key part of Meta’s advertising business model, the company has faced headwinds in this regard and is working hard to find a workaround such as its “conversions API”.
Meta Revenue (Q3,22 report)
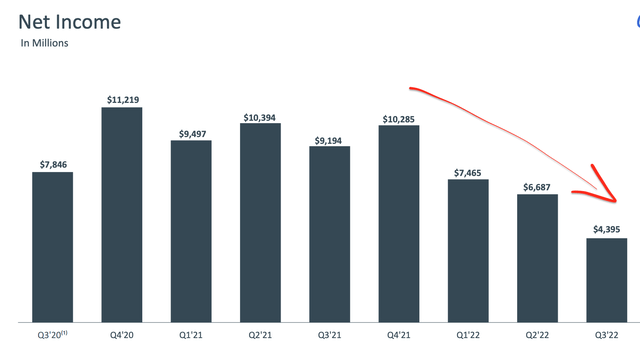
Meta generated $4.4 billion in net income which plummeted by a staggering 57% year over year. This was caused by a substantial 19% increase in expenses which rose to $22.05 billion in the third quarter. A positive is this was $413 million of this was caused by a “one-off” expense related to its office space, as the company aims to streamline its operations. Approximately $9.17 billion of its expenses, were related to Research & Development [R&D]. I don’t necessarily believe that this is a bad sign, as companies that invest in R&D tend to generate greater shareholder returns long term. Meta has been accelerating its investments in R&D, which increased by 45% year over year. The market doesn’t seem to be pricing in a return on these investments, especially those related to the “metaverse” which I discussed in my past post. The “Metaverse” may seem like a long way off and very random. However, it is actually closer related to Meta’s core social media business than you may think. As Zuckerberg likes to say the mission of Meta is to “connect people”. Social media platforms enable this connection, and technologies such as Virtual Reality [VR] just enhance this.
Net Income (Q3,22 report)
Meta also has a robust balance sheet with approximately $41.78 billion in cash, cash equivalents, and marketable securities. In addition, the company does have a fairly high total debt of $26.5 billion, with $9.92 billion is long-term debt. The company repurchased $6.55 billion in stock in the third quarter of 2022, which is positive and shows confidence.
Advanced Valuation
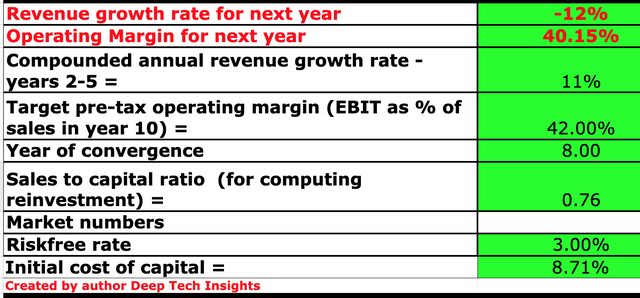
To value Meta, I have plugged its latest financials into my discounted cash flow model. I have revised my estimates slightly since my last model as I have accounted for new economic updates and forecasts. In this case, I have forecast negative 12% revenue growth for next year. I expect this to be driven by continued foreign exchange headwinds and the forecasted recession, which will impact advertising revenue. However, in years 2 to 5 I have forecast improving economic conditions and also I expect Meta’s monetization issues with its new “Reels” format to be solved.
Meta stock valuation 1 (created by author Deep Tech Insights)
To increase the accuracy of the valuation model, I have capitalized R&D expenses which has lifted net income. In addition, I have forecast a 42% pre-tax operating margin over the next 8 years. I expect this to be driven partially by a return on its huge investments. In addition, WhatsApp has over 2 billion monthly active users and is currently not monetized.
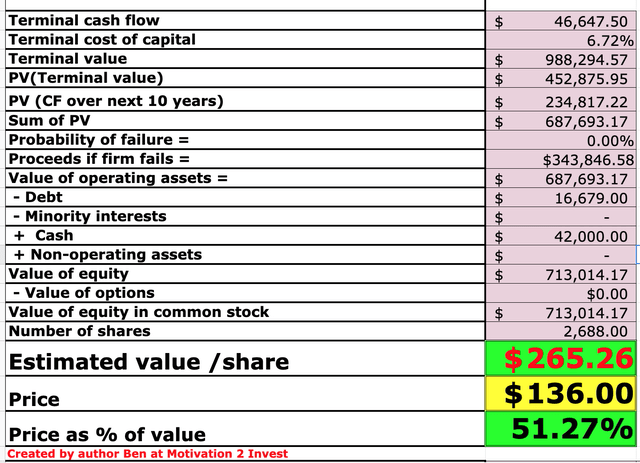
Meta stock valuation 2 (Created by author Deep Tech Insights)
Given these factors I get a fair value of $265 per share, its stock is currently trading at $136 per share at the time of writing and thus it is 49% undervalued or “deeply undervalued”.
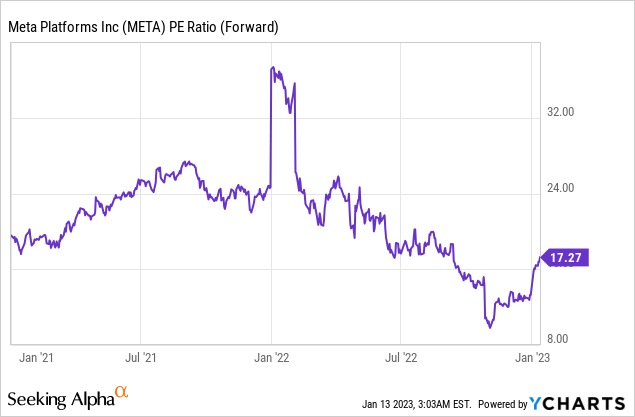
Meta is also trading at a price-to-earnings ratio = 14.6, which is 38.7% cheaper than its 5-year average.
Risks
Recession/Cyclical Advertising market
The World Bank recently (January 10th, 2023) slashed its GDP growth forecast. The U.S. is now only expected to have moderate growth of 0.5% and flat GDP is forecast for the eurozone. A recession is defined as at least two straight quarters of falling GDP growth. Although we aren’t technically in a recession yet, we are on the edge of one. Either way, the “fear” of a recession has already caused advertisers to pull back advertising spend. In my reports on major advertising companies such as Google (GOOG) (GOOGL) and of course Meta, this trend showed up.
Final Thoughts
Meta is a social media powerhouse that still has a solid 3.71 billion monthly active people using its platforms, which has grown by 3.6% year over year, despite the misconception that its users have fallen. In addition, the company has a major opportunity to generate at least some return from its huge investments in the Metaverse. Meta can also unlock the monetization power of WhatsApp. Given this backdrop of positivity, its strong technical chart and its deeply undervalued share price, Meta is likely a solid long-term investment.


