May Lim/iStock via Getty Images
Ares Capital Corp (NASDAQ:ARCC) and Blue Owl Capital Corp (NYSE:OBDC) are both blue chip Business Development Companies that offer 10%-12% dividend yields. In this article, we compare them side by side and offer our take on which is the better buy right now.
OBDC Stock Vs. ARCC Stock: Balance Sheet
Comparing ARCC and OBDC overall, according to CEFData.com their leverage ratios are at roughly the same level. Additionally, they both hold investment grade credit ratings from multiple credit rating agencies. Moreover, both entities have considerable liquidity with well-staggered debt maturities that limit their capital markets risk.
Taking a closer look at the details, ARCC achieved a sequential decrease in its leverage ratio, moving from 1.09x to 1.07x in the latest quarter. Furthermore, 68% of its existing debt is structured at a fixed rate, carrying a weighted average interest rate of 3.37%. This debt has a weighted average maturity term of 3.19 years, contributing to an overall blended weighted average interest rate of 4.56%. Moreover, as is evident from the graphic below, it has relatively minimal refinancing risk through 2024:
ARCC Upcoming Maturities (Investor Presentation)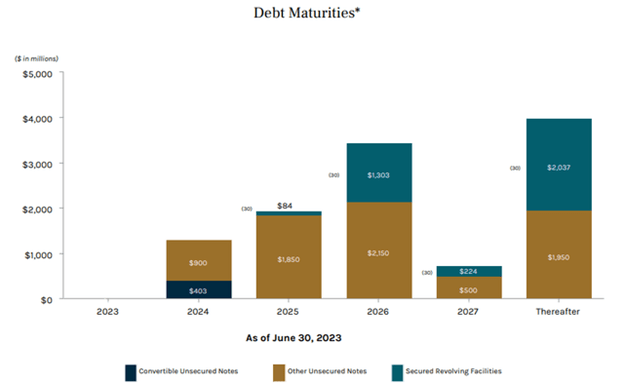
OBDC, meanwhile, also achieved sequential improvement in its leverage ratio, reducing it from 1.21x at the end of Q1 to 1.14x at the end of Q2. OBDC also has substantial liquidity with $1.8 billion in cash and undrawn debt as of the end of Q2 and – like ARCC – has only minimal refinancing exposure through 2024:
Debt Maturities (Investor Presentation)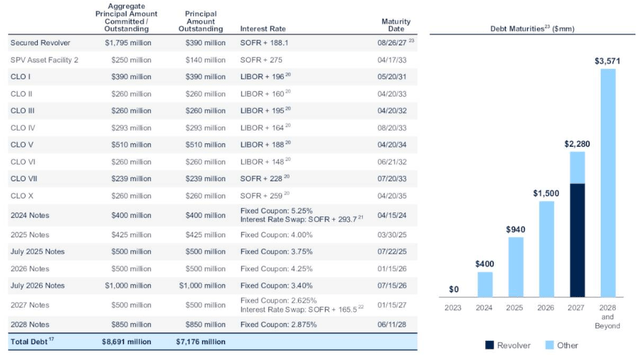
OBDC Stock Vs. ARCC Stock: Investment Portfolio
69% of OBDC’s investment portfolio is allocated to first lien senior secured loans and 14.1% is allocated to second lien senior secured loans. In contrast, ARCC’s investment portfolio is 41.7% allocated to first lien senior secured loans and 23% is allocated to second lien senior secured loans. As a result, OBDC has a much greater allocation to more conservatively positioned loans. Meanwhile, ARCC has greater exposure to higher risk – higher reward preferred equity and common equity investments.
Furthermore, OBDC’s more conservative posturing of its portfolio seems to be paying off as only 0.9% of its portfolio at fair value is on non-accrual, whereas ARCC has 1.1% of its portfolio at fair value on non-accrual. That said, given that OBDC has substantially more exposure to first lien and overall senior secured loans, this difference in non-accruals is not very significant. This indicates that ARCC’s underwriting is quite strong and enables them to reach out further on the risk spectrum without compromising shareholder risk.
OBDC Stock Vs. ARCC Stock: Dividend Outlook
While ARCC has a lengthy track record of sustaining and even growing its dividend, OBDC’s short public history makes its dividend track record much briefer and less proven. That said, both company’s dividends appear well covered today.
During its latest quarter, ARCC paid a $0.48 dividend per share that was effectively supported by a per-share net investment income of $0.57 in Q2. This robust performance resulted in a favorable coverage ratio of 1.19x. OBDC, meanwhile, generated net investment income per share of $0.48 that covered its $0.40 dividend payout by 1.2x. Moreover, its regular dividend of $0.33 was covered even more easily at a 1.45x ratio, making it one of the best covered regular dividends in the BDC sector at the moment. Given that its current yield is 9.52% based on its regular dividend alone, OBDC offers a very attractive combination of yield and safety.
The management teams offered the following commentary on their latest earnings calls regarding their respective dividend payout outlooks:
Earnings are well in excess of the [current] dividend level. That’s prudent… If we pull a couple of the different levers that could allow us to have a higher dividend or a lower dividend, the one that’s the most impactful would be a significant decrease in base rates. You’d have to model non-accruals up a lot to have it to have any real impact on how we thought about the dividend today.
…[we’ve] been really pleased with how the supplemental dividend has worked… [we’re] trying to strike this balance with offering the clear certainty of the stated dividend, plus the predictability of the supplemental… our underlying assets are floating rate, and they move around. So how do you offer certainty of something that’s fundamentally moving around? And we think the supplemental construction is a great way to do that… our investors should have a high degree of confidence at these earnings levels, exactly what the supplemental will be. We basically committed to pay out 50% in excess. And then we’re building a very nice amount of additional spillover income, which we never had before as a more relatively new public company…
We’re all shareholders. I’m a shareholder. I like getting dividends. We’re going to continue to look for ways for increasing them. But we also know that people value consistency. And so we don’t want to lean into something, and then 3 or 6 months later, it creates some unnecessary anxiety about whether it’s going to get reduced again. And I think this formula really does a nice job of balancing those two.
The bottom line of both of these statements is that ARCC and OBDC feel quite confident in the sustainability of their current base dividends, even if interest rates pull back and non accruals increase meaningfully. However, given that the future direction of interest rates and the economy are quite uncertain right now, both management teams are being conservative with their dividend policies. Rather than increasing their base payouts, they are building up spillover income while also paying out special dividends as needed to meet their obligations as BDCs.
OBDC Stock Vs. ARCC Stock: Valuation
When it comes to valuation, OBDC appears to have the edge on ARCC. ARCC’s NTM yield is 10.0% is meaningfully lower than OBDC’s NTM yield of 11.5% and its NTM P/E ratio is higher at 8.34x compared to OBDC’s NTM P/E ratio of 7.47x. Finally, ARCC’s price to NAV is 1.04x compared to OBDC’s discounted price to NAV of 0.91x.
OBDC Stock Vs. ARCC Stock: Which Stock Is The Better Buy?
It is hard to argue with ARCC’s impressive track record of delivering stable and attractive quarterly base dividends alongside some juicy special dividends. Moreover, it has generated total returns that crush those of its broader sector as well as the S&P 500:
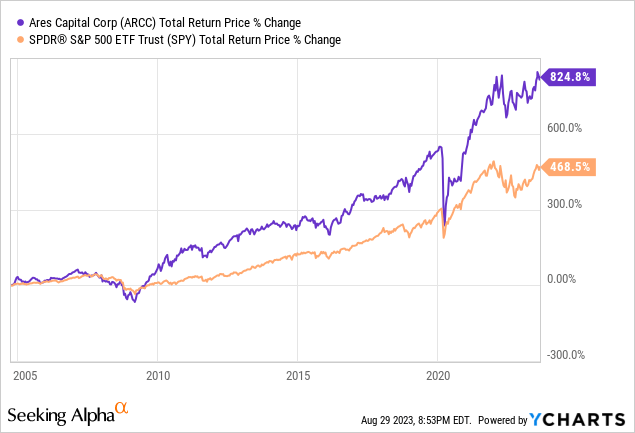
In contrast, OBDC has a much shorter track record and has meaningfully underperformed ARCC over that period:
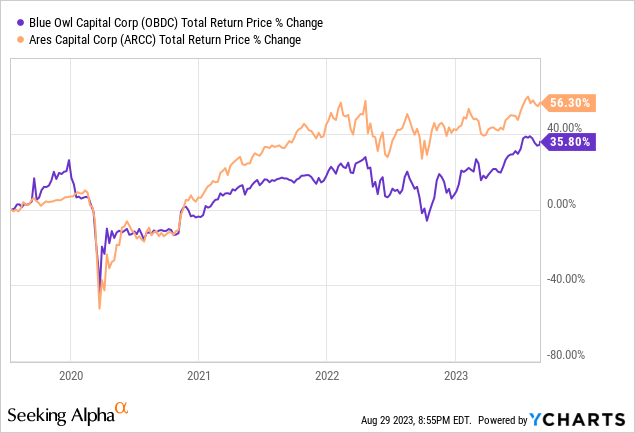
Furthermore, ARCC’s underwriting skill appears to be superior given that it invests in riskier asset classes on average, but its non-accruals relative to fair value are only 20 basis points higher than OBDC’s. As a result, many may favor ARCC as it is a proven performer that has also outperformed OBDC over the few years that OBDC has been publicly traded.
That being said, there are reasons to favor OBDC at the moment:
- Its portfolio is more conservatively positioned, which means that if the economy deteriorates further, its underwriting performance lead over ARCC should increase further. Of course, the inverse is true in that if the economy can avoid a hard landing, ARCC’s total return outperformance relative to OBDC may very well expand.
- OBDC is trading at a meaningful discount to NAV whereas ARCC is currently trading at a premium to NAV. As a result, you get more underlying asset for your dollar when buying OBDC shares.
- OBDC’s regular dividend is better covered by net investment income than ARCC’s. When combined with its more conservatively positioned portfolio, it makes for a much safer dividend payout.
- OBDC’s special dividends make its total dividend yield ~15% greater than ARCC’s, combining with its discount to NAV to give it better total return potential on the surface than ARCC offers.
Overall, we see no issue with owning either or both of these BDCs. ARCC’s proven track record may make it easier to hold for retirees, while value investors seeking to scrape every last penny of yield out of their investments may very well favor OBDC.


