Published on March 31st, 2023 by Bob Ciura
Blue chip stocks are generally those that have safe dividends, even during recessions, along with the ability to increase dividends over time.
At Sure Dividend, we qualify blue-chip stocks as companies that are members of 1 or more of the following 3 lists:
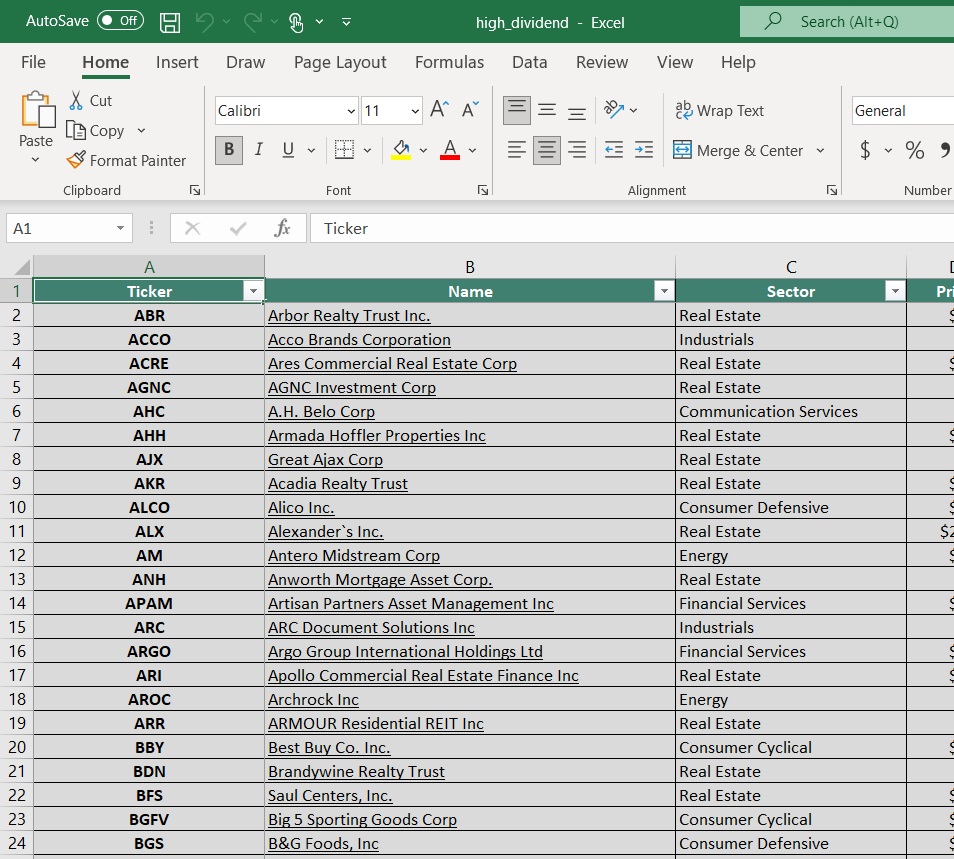
You can download the complete list of all 350+ blue-chip stocks (plus important financial metrics such as dividend yield, P/E ratios, and payout ratios) by clicking below:
In addition to the Excel spreadsheet above, this article covers our top 20 safe blue-chip stocks with high dividend yields and low volatility (measured by 5-year annualized standard deviation) from the Sure Analysis Research Database.
In this section, stocks were further screened for a satisfactory Dividend Risk score of ‘C’ or better. The stocks are listed by 5-year annualized standard deviation, from lowest to highest.
The table of contents below allows for easy navigation.
Table of Contents
Blue-Chip Stock #1: Verizon Communications (VZ)
- Dividend History: 18 years of consecutive increases
- Dividend Yield: 6.8%
- 5-year Annualized Standard Deviation: 16.59%
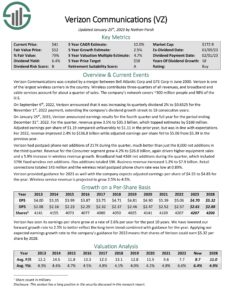
Verizon is one of the largest wireless carriers in the country. Wireless generates three-quarters of the total revenues of the company while broadband and cable services account for about a quarter of sales. The network of Verizon covers approximately 300 million people and 98% of the U.S.
Verizon enjoys a key competitive advantage, namely its reputation as the best wireless carrier in the U.S. This is clearly reflected in the wireless net additions of the company and its exceptionally low churn rate. This reliable service allows Verizon to maintain its customer base and move some customers to higher-priced plans.
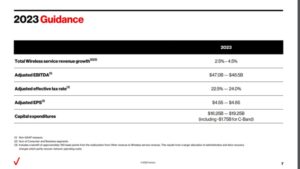
Verizon exhibits lackluster business momentum right now. Last year, the company posted essentially flat sales and saw its earnings per share dip 6% due to high operating expenses as well as high interest expense. Verizon has provided guidance for earnings per share of $4.55-$4.85 in 2023, implying a further 7% decrease.
Source: Investor Presentation
Verizon is currently trading near a 10-year high dividend yield. Thanks to the solid payout ratio of 56%, the strong business position of the company and its resilience to recessions, its dividend should be considered safe.
It is also worth noting that Verizon has grown its dividend for 18 consecutive years.
Click here to download our most recent Sure Analysis report on Verizon (VZ) (preview of page 1 of 3 shown below):
Blue-Chip Stock #2: W.P. Carey (WPC)
- Dividend History: 28 years of consecutive increases
- Dividend Yield: 5.5%
- 5-year Annualized Standard Deviation: 24.48%
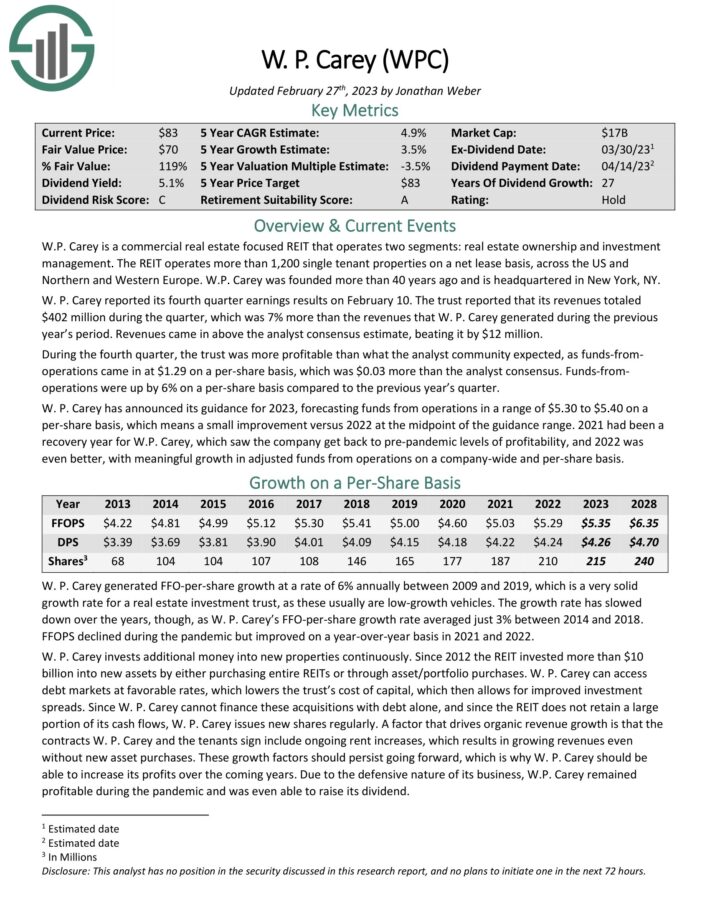
W.P. Carey is a Real Estate Investment Trust (or REIT) with two segments: real estate ownership and investment management. The former is the much larger of the business, with more than 1,200 single-tenant properties across the U.S. and Northern and Western Europe.
W. P. Carey reported its fourth quarter earnings results on February 10. The trust reported that its revenues totaled $402 million during the quarter, which was 7% more than the revenues that W. P. Carey generated during the previous year’s period. Revenues came in above the analyst consensus estimate by $12 million.
During the fourth quarter, funds-from operations came in at $1.29 on a per-share basis, which was $0.03 more than the analyst consensus. Funds-from operations were up by 6% on a per-share basis compared to the previous year’s quarter.
W. P. Carey has announced its guidance for 2023, forecasting funds from operations in a range of $5.30 to $5.40 on a per-share basis, which means a small improvement versus 2022 at the midpoint of the guidance range.
The trust has spent more than $10 billion over the last decade acquiring properties to grow its portfolio. Much of this acquisition spree has been through the use of share issuance, as the share count has nearly tripled since 2012. That being the case, growth has been very steady for W.P. Carey even as the float has gotten larger.
W.P. Carey raises its dividend slightly every quarter, though the five-year CAGR is under 1%. Even so, the stock has a 5.3% yield and a dividend growth streak of 28 years. The forecasted payout ratio is 80%, a reasonable rate for a REIT.
Click here to download our most recent Sure Analysis report on W. P. Carey (WPC) (preview of page 1 of 3 shown below):
Blue-Chip Stock #3: 3M Company (MMM)
- Dividend History: 65 years of consecutive increases
- Dividend Yield: 5.8%
- 5-year Annualized Standard Deviation: 24.78%
3M sells more than 60,000 products that are used every day in homes, hospitals, office buildings and schools around the world. It has about 95,000 employees and serves customers in more than 200 countries.
The company separately announced that it will spinoff its healthcare segment. This is a major announcement, as the healthcare business itself generates over $8 billion in annual sales.
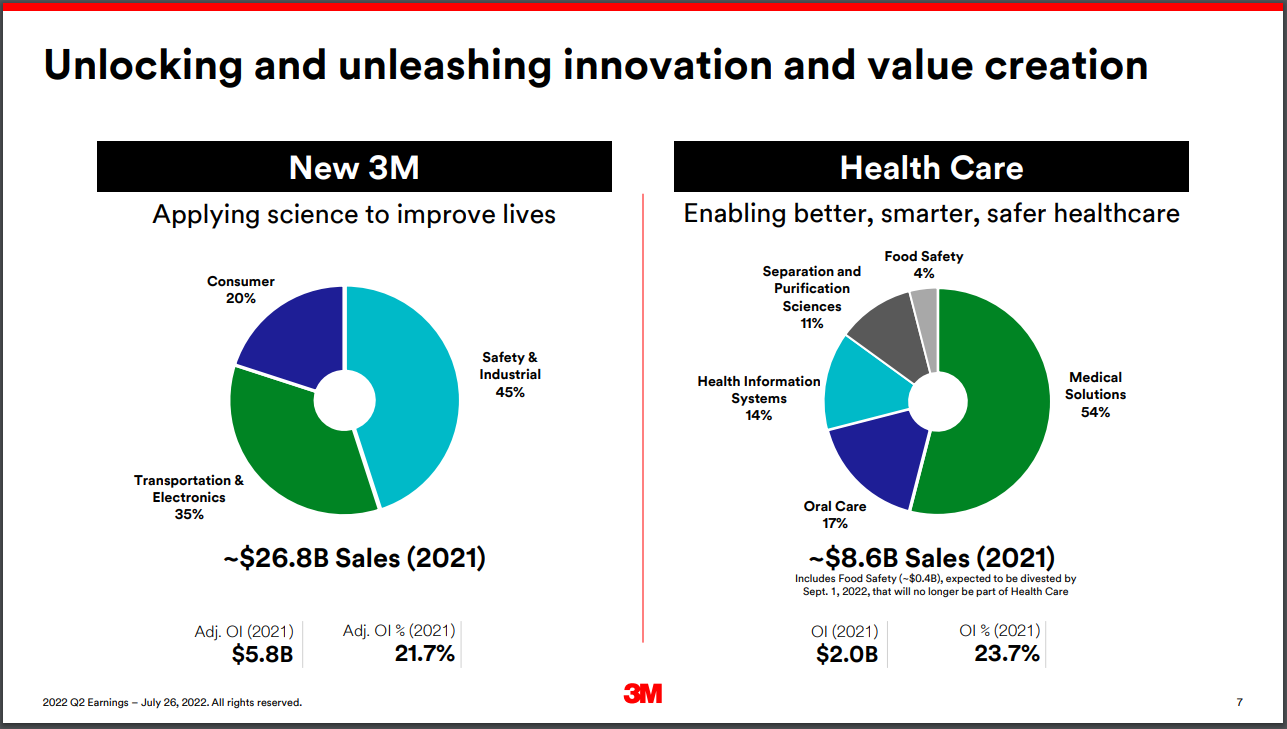
Source: Investor Presentation
The transaction is expected to close by the end of 2023.
On January 24th, 2023, 3M reported announced earnings results for the fourth quarter and full year for the period ending December 31st, 2022. For the quarter, revenue declined 5.9% to $8.1 billion, but was $10 million more than expected. Adjusted earnings-per-share of $2.28 compared to $2.31 in the prior year and was $0.11 less than projected.
For 2022, revenue decreased 3% to $34.2 billion. Adjusted earnings-per-share for the period totaled $10.10, which compared unfavorably to $10.12 in the previous year and was at the low end of the company’s guidance.
Organic growth for the quarter was 1.2%. Health Care, Transportation & Electronics, and Safety & Industrial grew 1.9%, 1.4%, and 1.3%, respectively. Consumer fell 5.7%. The company will cut 2,500 manufacturing jobs. 3M provided an outlook for 2023, with the company expecting adjusted earnings-per-share in a range of $8.50 to $9.00.
Click here to download our most recent Sure Analysis report on 3M (preview of page 1 of 3 shown below):
Blue-Chip Stock #4: Altria Group (MO)
- Dividend History: 53 years of consecutive increases
- Dividend Yield: 8.4%
- 5-year Annualized Standard Deviation: 25.56%
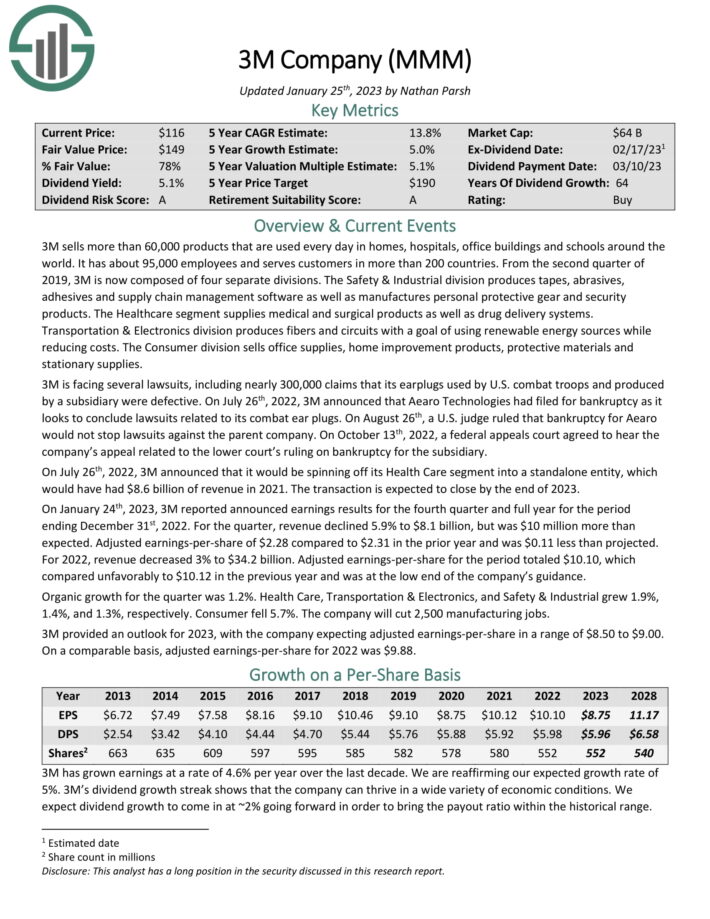
Altria is a consumer staples giant, with a history of 175 years. The company is the producer of the top-selling cigarette brand in the world, namely Marlboro, as well as some non-smokeable products.
The tobacco giant has maintained a market share of about 40%-43% for several years in a row.

Source: Investor Presentation
Altria also has large stakes in global beer giant Anheuser Busch InBev (BUD) and Cronos Group (CRON), a cannabis company.
Altria has a rock-solid business model in place. Thanks to the inelastic demand for its products, the company has been raising its prices year after year. As a result, it has more than offset the effect of the steadily declining consumption per capita of cigarettes on its earnings.
Due to its strong pricing power, Altria has grown its earnings per share every single year over the last decade, at an 8.8% average annual rate. The consistent growth record of Altria is a testament to the strength of its business model.
Click here to download our most recent Sure Analysis report on Altria (MO) (preview of page 1 of 3 shown below):
Blue-Chip Stock #5: Digital Realty (DLR)
- Dividend History: 17 years of consecutive increases
- Dividend Yield: 5.2%
- 5-year Annualized Standard Deviation: 25.77%
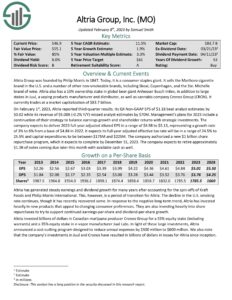
Digital Realty Trust is a REIT that is a leader in buying and developing properties for technological uses. Digital Realty’s properties are a combination of data centers that store and process information, technology manufacturing sites and Internet gateway data centers which allow major metro areas to transmit data. The company operates over 300 facilities in 28 countries on 6 continents.
On March 3rd, 2022, Digital Realty declared a $1.22 quarterly dividend, marking a 5% increase and the company’s 17th straight year of increasing its payout. On February 16th, 2023, Digital Realty reported Q4 2022 results for the period ending December 31st, 2022.
For the quarter, Digital Realty’s revenue came in at $1.2 billion, a 3% increase compared to Q4 2021. During the quarter, the company generated $1.65 in core FFO per share compared to $1.67 per share prior. Digital Realty also initiated 2023 guidance, anticipating $5.7 billion to $5.8 billion in revenue and $6.65 to $6.75 in core FFO.
Click here to download our most recent Sure Analysis report on Digital Realty (preview of page 1 of 3 shown below):
Blue-Chip Stock #6: First of Long Island Corp. (FLIC)
- Dividend History: 45 years of consecutive increases
- Dividend Yield: 6.3%
- 5-year Annualized Standard Deviation: 25.96%
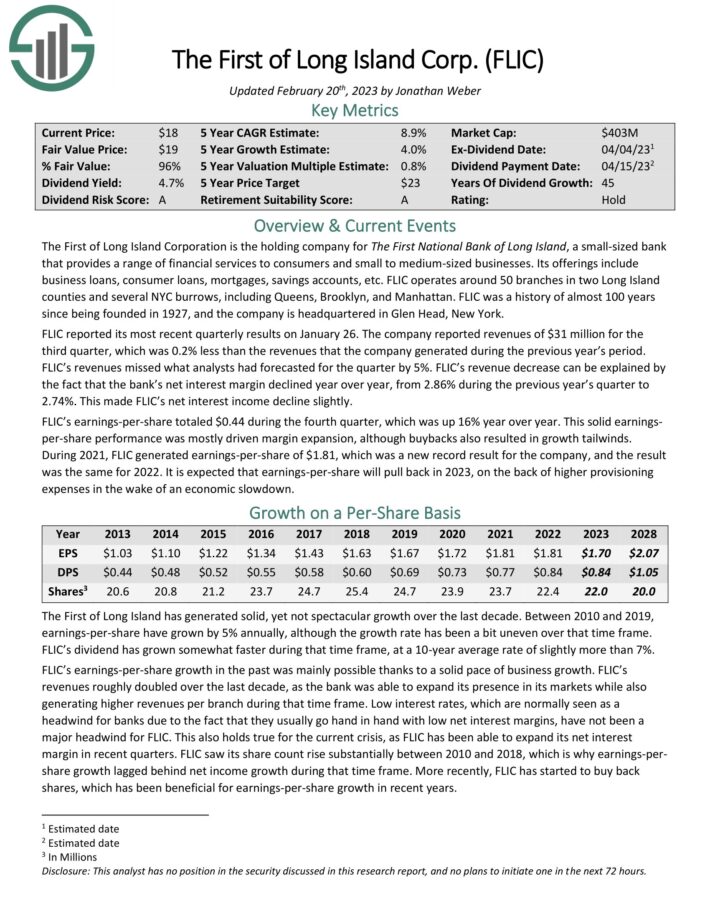
The First of Long Island Corporation is the holding company for The First National Bank of Long Island. This small-sized bank provides a range of financial services to consumers and small to medium-sized businesses. Its offerings include business loans, consumer loans, mortgages, savings accounts, etc.
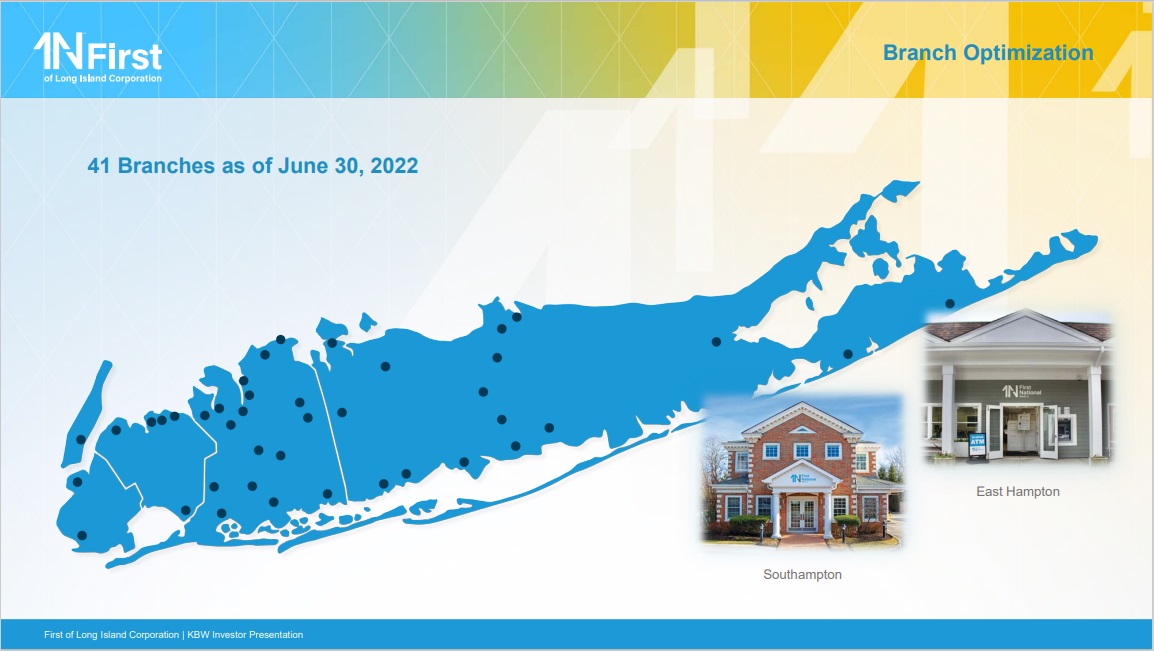
FLIC operates over 40 branches in two Long Island counties and several NYC burrows, including Queens, Brooklyn, and Manhattan.
Source: Investor Presentation
FLIC reported its most recent quarterly results on January 26. The company reported revenues of $31 million for the third quarter, which was 0.2% less than the revenues that the company generated during the previous year’s period. FLIC’s revenues missed what analysts had forecasted for the quarter by 5%. The revenue decrease can be explained by the fact that the bank’s net interest margin declined year over year, from 2.86% during the previous year’s quarter to 2.74%. This made FLIC’s net interest income decline slightly.
FLIC’s earnings-per-share totaled $0.44 during the fourth quarter, which was up 16% year over year. This solid earnings-per-share performance was mostly driven margin expansion, although buybacks also resulted in growth tailwinds. During 2021, FLIC generated earnings-per-share of $1.81, which was a new record result for the company, and the result was the same for 2022.
Click here to download our most recent Sure Analysis report on FLIC (preview of page 1 of 3 shown below):
Blue-Chip Stock #7: Bank of Nova Scotia (BNS)
- Dividend History: 11 years of consecutive increases
- Dividend Yield: 6.2%
- 5-year Annualized Standard Deviation: 25.97%
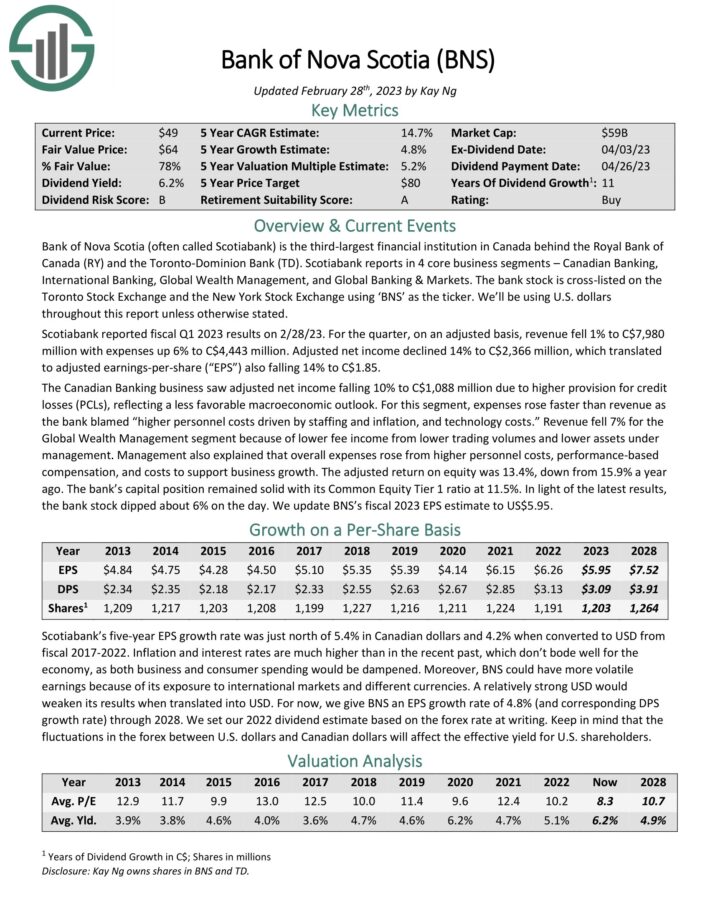
Bank of Nova Scotia (often called Scotiabank) is the fourth-largest financial institution in Canada behind the Royal Bank of Canada, the Toronto-Dominion Bank and Bank of Montreal. Scotiabank reports in four core business segments – Canadian Banking, International Banking, Global Wealth Management, and Global Banking & Markets.
Scotiabank reported fiscal Q4 2022 results on November 29th, 2022. For the quarter, adjusted net income decreased 4%, while adjusted EPS decreased 2% year over year. The adjusted return on equity (ROE) was 15.0%, down from 15.6% a year ago.
We expect annual returns of 16.7% for BNS stock, making it No. 1 among Canadian bank stocks right now.
Click here to download our most recent Sure Analysis report on BNS (preview of page 1 of 3 shown below):
Blue-Chip Stock #8: Enbridge Inc. (ENB)
- Dividend History: 27 years of consecutive increases
- Dividend Yield: 6.9%
- 5-year Annualized Standard Deviation: 26.30%
Enbridge is an oil & gas company that operates the following segments: Liquids Pipelines, Gas Distributions, Energy Services, Gas Transmission & Midstream, and Green Power & Transmission. Enbridge bought Spectra Energy for $28 billion in 2016 and has become one of the largest midstream companies in North America.
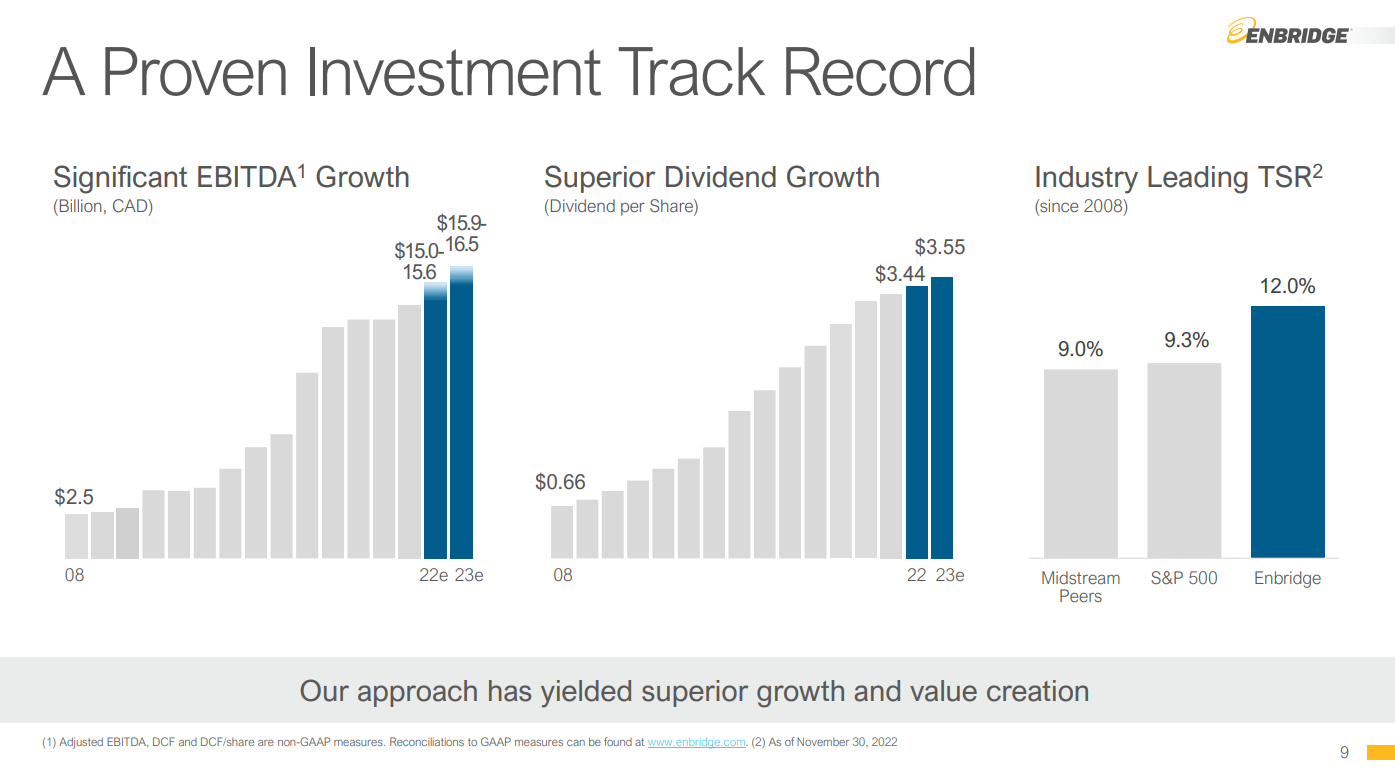
Boasting 27 years of consecutive dividend increases, Enbridge has undoubtedly established its operational resilience capabilities. As critical energy infrastructure assets have become more essential than ever in today’s economy, Enbridge’s performance will likely remain robust in the coming years and in the long term.
Source: Investor Presentation
Enbridge reported its fourth quarter earnings results on February 10th. The company generated higher revenues during the quarter, but since commodity prices are mostly a pass-through cost for the company, higher revenues do not necessarily translate into higher profits.
During the quarter, Enbridge still managed to grow its adjusted EBITDA by 6% year over year, to CAD$3.9 billion, up from CAD$3.7 billion during the previous year’s quarter. This was possible thanks to stronger contributions from the liquids pipelines segment primarily.
Enbridge was able to generate distributable cash flows of CAD$2.7 billion, which equates to US$2.0 billion, or US$0.99 on a per-share basis, which was up by a solid 7% year over year in CAD. Enbridge is forecasting distributable cash flows in a range of CAD$5.25-5.65 per share for the current year.
With its payout ratio standing at a healthy 68% and its vast asset footprint serving as a tremendous competitive advantage, we believe Enbridge should continue serving income-oriented investors adequately for decades.
Click here to download our most recent Sure Analysis report on Enbridge Inc. (preview of page 1 of 3 shown below):

Blue-Chip Stock #9: International Business Machines (IBM)
- Dividend History: 27 years of consecutive increases
- Dividend Yield: 5.1%
- 5-year Annualized Standard Deviation: 26.67%
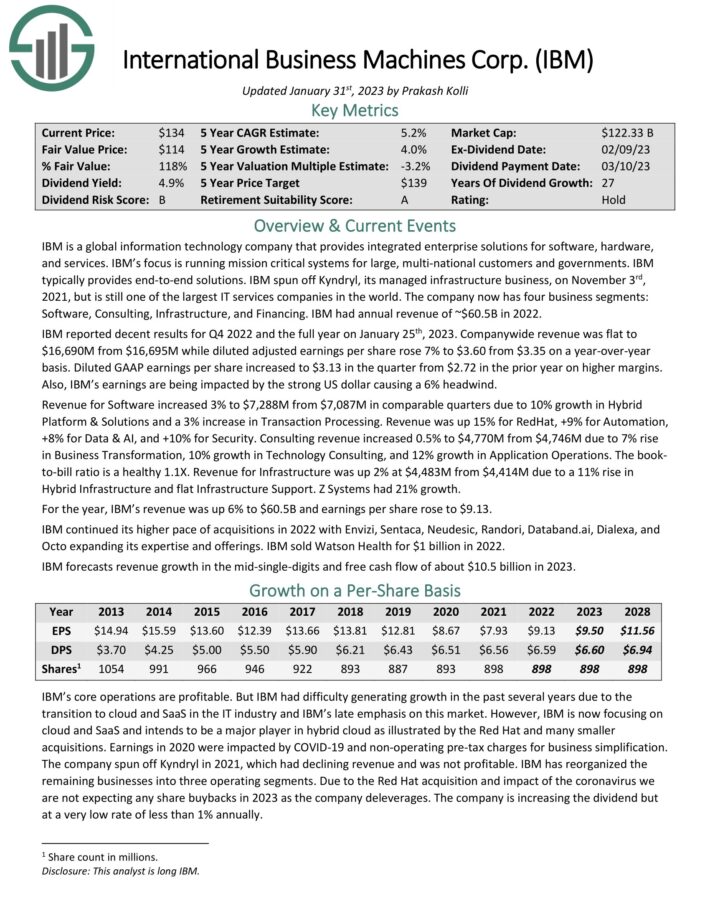
IBM is a global information technology company that provides integrated enterprise solutions for software, hardware, and services. IBM’s focus is running mission critical systems for large, multi-national customers and governments. IBM typically provides end-to-end solutions.
IBM reported results for Q4 2022 and the full year on January 25th, 2023. Company-wide revenue was flat while diluted adjusted earnings per share rose 7% to $3.60 from $3.35 on a year-over-year basis. Diluted GAAP earnings per share increased to $3.13 in the quarter from $2.72 in the prior year on higher margins. Also, IBM’s earnings are being impacted by the strong US dollar causing a 6% headwind.
Revenue for Software increased 3% to $7,288M from $7,087M in comparable quarters due to 10% growth in Hybrid Platform & Solutions and a 3% increase in Transaction Processing. Revenue was up 15% for RedHat, +9% for Automation, +8% for Data & AI, and +10% for Security. Consulting revenue increased 0.5% due to a 7% rise in Business Transformation, 10% growth in Technology Consulting, and 12% growth in Application Operations.
The book-to-bill ratio is a healthy 1.1X. Revenue for Infrastructure was up 2% at $4,483M from $4,414M due to a 11% rise in Hybrid Infrastructure and flat Infrastructure Support. Z Systems had 21% growth. For the year, IBM’s revenue was up 6% to $60.5B and earnings per share rose to $9.13.
Click here to download our most recent Sure Analysis report on IBM (preview of page 1 of 3 shown below):
Blue-Chip Stock #10: Philip Morris International (PM)
- Dividend History: 15 years of consecutive increases
- Dividend Yield: 5.3%
- 5-year Annualized Standard Deviation: 27.00%
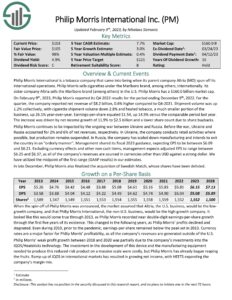
Philip Morris was formed when its parent company Altria spun off its international operations. Philip Morris sells cigarettes under the Marlboro brand and others brands in international markets.
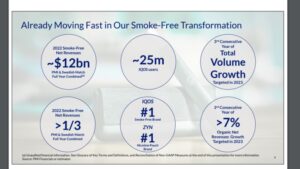
Philip Morris has one of the most valuable cigarette brands in the world, Marlboro, and is a leader in the reduced-risk product category with iQOS.
Source: Investor Presentation
Thanks to its strong business position, it is a low-risk business. The only material risk comes from potential restrictions from regulatory authorities but Philip Morris is safer than many other tobacco companies in this regard thanks to its broad geographic diversification.
Philip Morris has grown its dividend for 15 consecutive years and is currently offering a nearly 10-year high dividend yield of 5.6%. Its payout ratio is too high, at 83%, but the company is likely to be able to defend its dividend now that its past investments have begun to bear fruit and capital requirements have decreased sharply. Nevertheless, it is prudent for investors to be prepared for modest dividend growth going forward.
On the other hand, thanks to the strong business momentum of its alternative tobacco products, Philip Morris expects to grow its currency-neutral earnings per share by about 6% this year, from $5.81 to an all-time high of $6.09-$6.21.
Click here to download our most recent Sure Analysis report on Philip Morris (PM) (preview of page 1 of 3 shown below):
Blue-Chip Stock #11: Canadian Imperial Bank of Commerce (CM)
- Dividend History: 12 years of consecutive increases
- Dividend Yield: 6.0%
- 5-year Annualized Standard Deviation: 27.68%
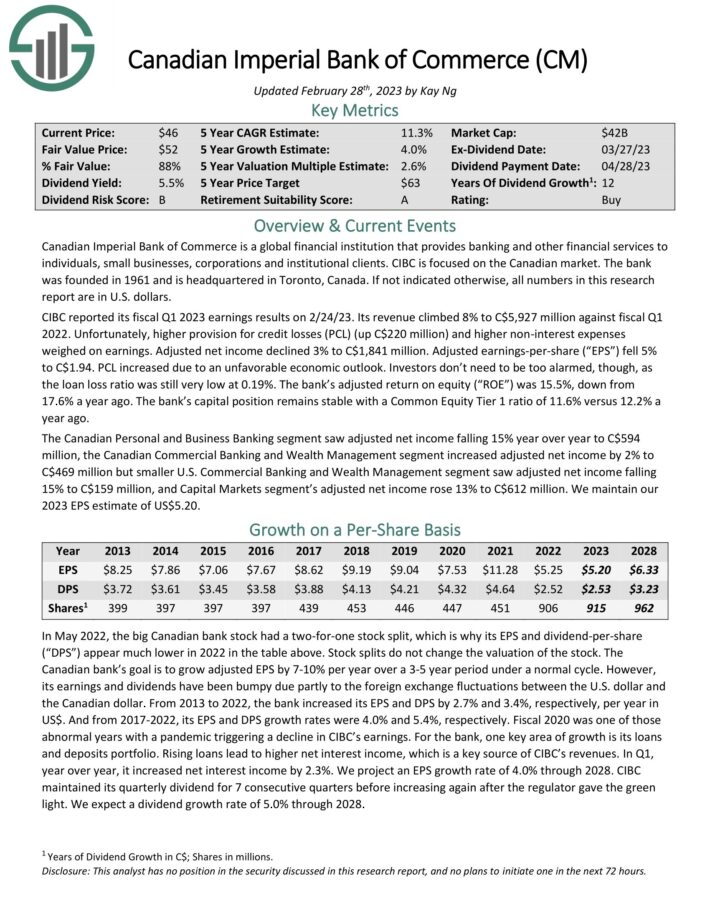
Canadian Imperial Bank of Commerce is a global financial institution that provides banking and other financial services to individuals, small businesses, corporations, and institutional clients. CIBC was founded in 1961 and is headquartered in Toronto, Canada.
On December 1st, 2022, CIBC reported its fiscal Q4 2022 earnings results. For the quarter, revenue increased 6% while adjusted EPS decreased 17% year-over-year. Q4 adjusted return on equity was 11.2% (down from 14.7% a year ago).
Higher provision for credit losses (PCL) (up C$220 million) and higher non-interest expenses weighed on earnings. Adjusted net income declined 3% to C$1,841 million. Adjusted earnings-per-share (“EPS”) fell 5% to C$1.94. PCL increased due to an unfavorable economic outlook. The loan loss ratio was still very low at 0.19%.
The bank’s adjusted return on equity (“ROE”) was 15.5%, down from 17.6% a year ago. The bank’s capital position remains stable with a Common Equity Tier 1 ratio of 11.6% versus 12.2% a year ago.
Click here to download our most recent Sure Analysis report on CM (preview of page 1 of 3 shown below):
Blue-Chip Stock #12: Walgreens Boots Alliance (WBA)
- Dividend History: 47 years of consecutive increases
- Dividend Yield: 5.5%
- 5-year Annualized Standard Deviation: 28.76%
Walgreens Boots Alliance is the largest retail pharmacy in both the United States and Europe. Through its flagship Walgreens business and other business ventures, the company employs more than 325,000 people and has more than 13,000 stores.
Walgreens Boots Alliance is the largest retail pharmacy in both the United States and Europe. Through its flagship Walgreens business and other business ventures, the company employs more than 325,000 people and has more than 13,000 stores.
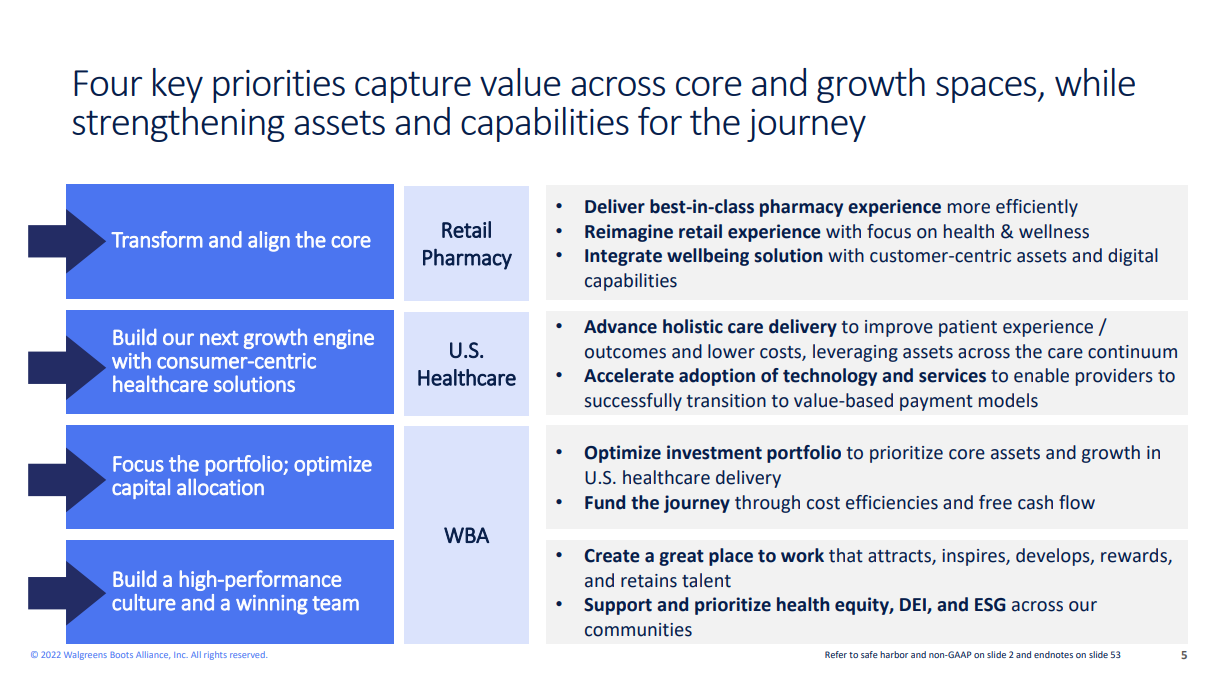
Source: Investor Presentation
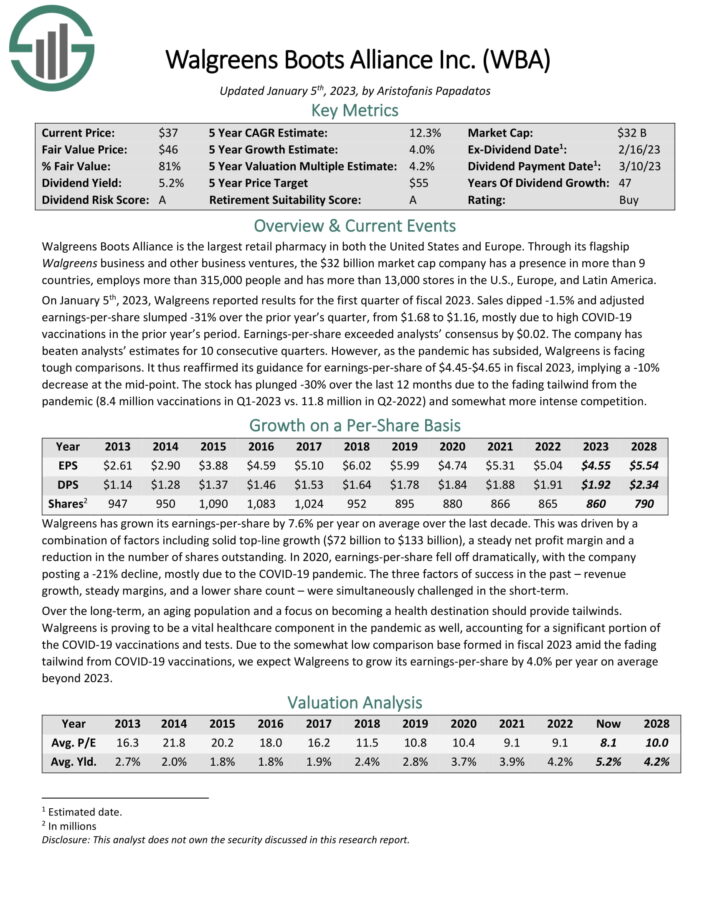
On January 5th, 2023, Walgreens reported results for the first quarter of fiscal 2023. Sales dipped -1.5% and adjusted earnings-per-share slumped -31% over the prior year’s quarter, from $1.68 to $1.16, mostly due to high COVID-19 vaccinations in the prior year’s period. Earnings-per-share exceeded analysts’ consensus by $0.02.
The company has beaten analysts’ estimates for 10 consecutive quarters. However, as the pandemic has subsided, Walgreens is facing tough comparisons. It thus reaffirmed its guidance for earnings-per-share of $4.45-$4.65 in fiscal 2023, implying a -10% decrease at the mid-point.
Click here to download our most recent Sure Analysis report on Walgreens Boots Alliance (preview of page 1 of 3 shown below):
Blue-Chip Stock #13: National Retail Properties (NNN)
- Dividend History: 21 years of consecutive increases
- Dividend Yield: 5.1%
- 5-year Annualized Standard Deviation: 30.03%
Lincoln National Corporation offers life insurance, annuities, retirement plan services and group protection. The corporation was founded in 1905 as The Lincoln National Life Insurance Company. Permission from Abraham Lincoln’s son to use the former president’s name was granted. In 1912, the company entered the reinsurance business. In 1969, Lincoln National Corp begins trading on the New York Stock Exchange and the Midwest Stock Exchange.
Lincoln National reported fourth quarter and full year 2022 results on February 8th, 2023, for the period ending December 31st, 2022. The company had net income of one penny per share in the fourth quarter, which compared unfavorably to $1.20 in the fourth quarter of 2021. Adjusted net income equaled $0.97 per share compared to $1.56 in the same prior year period. Additionally, annuities average account values shrunk by 16% to $144 billion and group protection insurance premiums grew 9% to $1.2 billion.
For the full year, Lincoln suffered an adjusted loss of $(5.22) per share compared to adjusted net income of $8.20 in
2021. These results included $12.21 of net unfavorable items due in large part to the company’s annual review of DAC and reserve assumptions.
The company repurchased 8.7 million shares of stock for $550 million in the trailing twelve months, reducing the share count by 7%. Book value per share (including adjusted income from operations (AOCI)) decreased 84% compared to the prior year to $18.41. Book value per share (excluding AOCI) decreased 18% to $63.73.
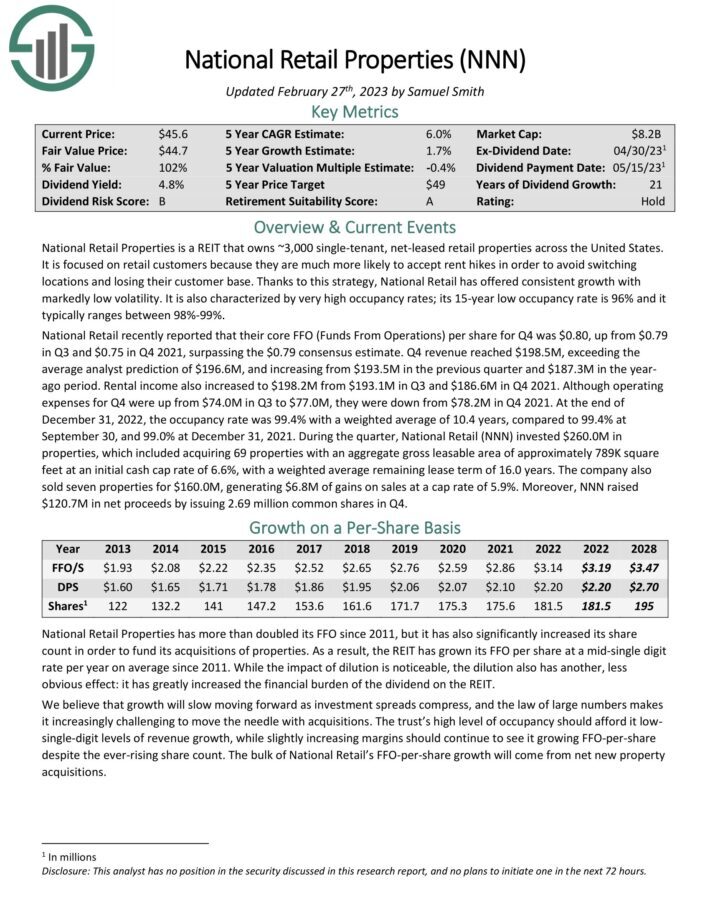
Click here to download our most recent Sure Analysis report on NNN (preview of page 1 of 3 shown below):
Blue-Chip Stock #14: Magellan Midstream Partners LP (MMP)
- Dividend History: 22 years of consecutive increases
- Dividend Yield: 7.7%
- 5-year Annualized Standard Deviation: 30.74%
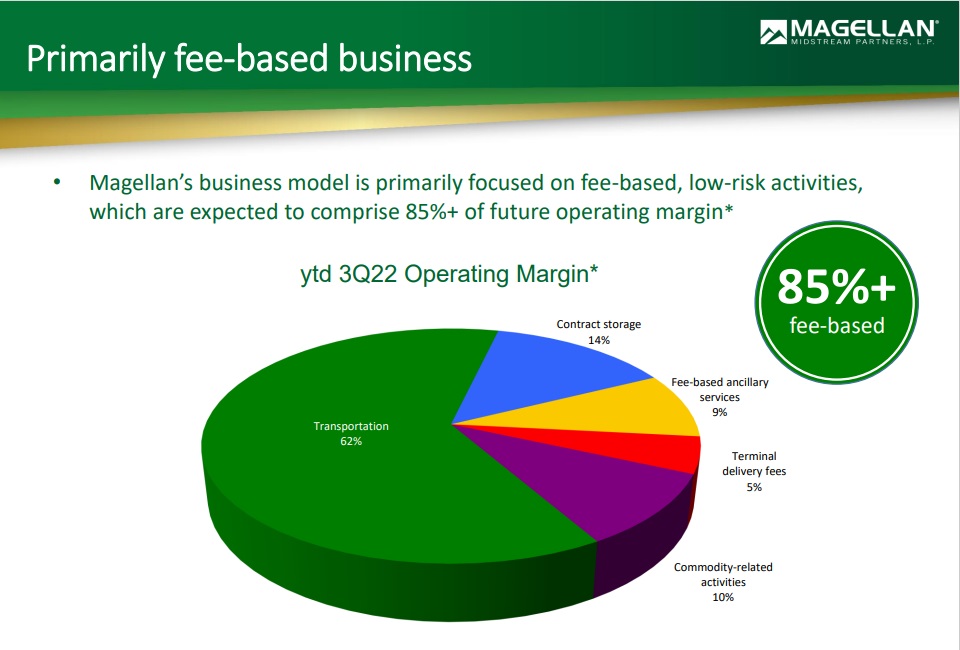
Magellan has the longest pipeline system of refined products, which is linked to nearly half of the total U.S. refining capacity.
Transportation generates over 60% of its total operating income. MMP has a fee-based model; only ~10% of its operating income depends on commodity prices.
Source: Investor Presentation
In early February, MMP reported (2/2/23) financial results for the fourth quarter of fiscal 2022. Distributable cash flow grew 16% over the prior year’s quarter, mostly thanks to increased volumes of refined products and improved commodity margins.
MMP has proved resilient to the pandemic and provided strong guidance for 2023. It expects annual distributable cash flow of $1.8 billion and a distribution coverage ratio of 1.4 for the full year.
The company has more than $500 million of potential growth projects under consideration and continues to evaluate their prospects in order to identify the most promising ones. In addition, share repurchases may constitute another significant growth driver.
Click here to download our most recent Sure Analysis report on MMP (preview of page 1 of 3 shown below):
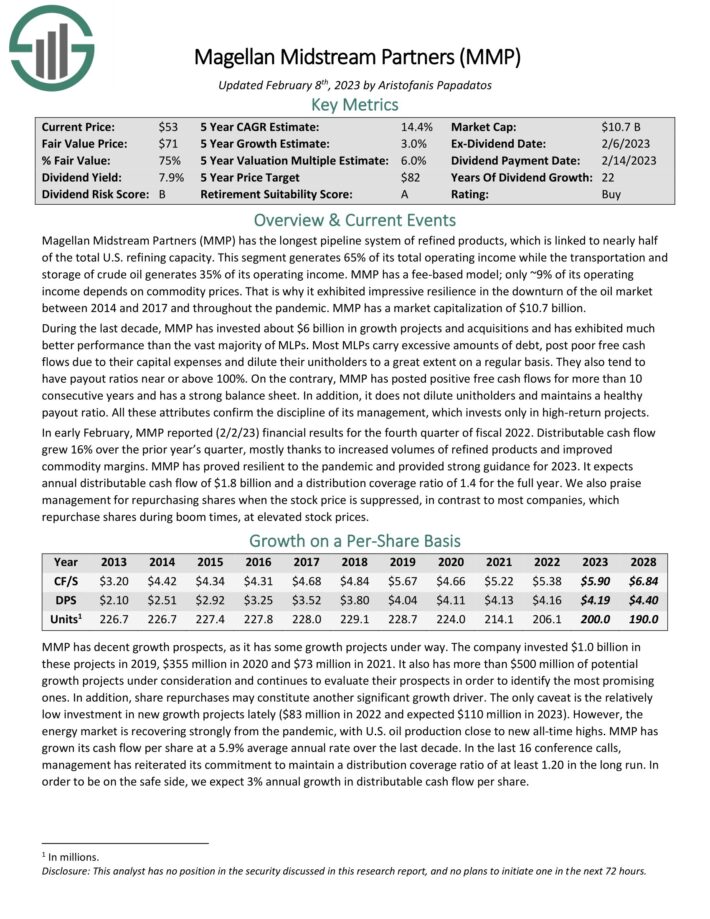
Blue-Chip Stock #15: Universal Corp. (UVV)
- Dividend History: 52 years of consecutive increases
- Dividend Yield: 6.0%
- 5-year Annualized Standard Deviation: 31.58%
Universal Corporation is a tobacco stock. It is the world’s largest leaf tobacco exporter and importer. The company is the wholesale purchaser and processor of tobacco that operates as an intermediary between tobacco farms and the companies that manufacture cigarettes, pipe tobacco, and cigars. Universal also has an ingredients business that is separate from the core leaf segment.
Universal Corporation reported its second quarter (fiscal 2023) earnings results in November. The company generated revenues of $1.1 billion during the quarter, which was 34% more than the revenues that Universal Corporation generated during the previous year’s period. Management explains that revenues were up due to a stronger product mix primarily.
Universal’s gross margin was down slightly compared to the previous year’s period, but that headwind was offset by higher revenues, which is why operating income still was up year over year. Universal’s adjusted earnings-per-share totaled $1.13 during the quarter, which was up on a year-over-year basis, thanks to higher operating income.
As the leader in a declining industry, we do not expect the company to deliver strong growth in the future. The company’s earnings-per-share could still rise over the next couple of years, however. Universal’s shares trade at a moderate valuation based on the earnings and cash flows that the company generates.
Universal also does not need to invest large amounts of money into its business, which gives it the ability to utilize a substantial amount of its free cash flows for share repurchases and dividends.
With a dividend payout of ~79% for the current fiscal year, we view Universal’s dividend as moderately safe, with the caveat that the company faces headwinds due to the steady decline of the tobacco industry.
Click here to download our most recent Sure Analysis report on Universal (preview of page 1 of 3 shown below):
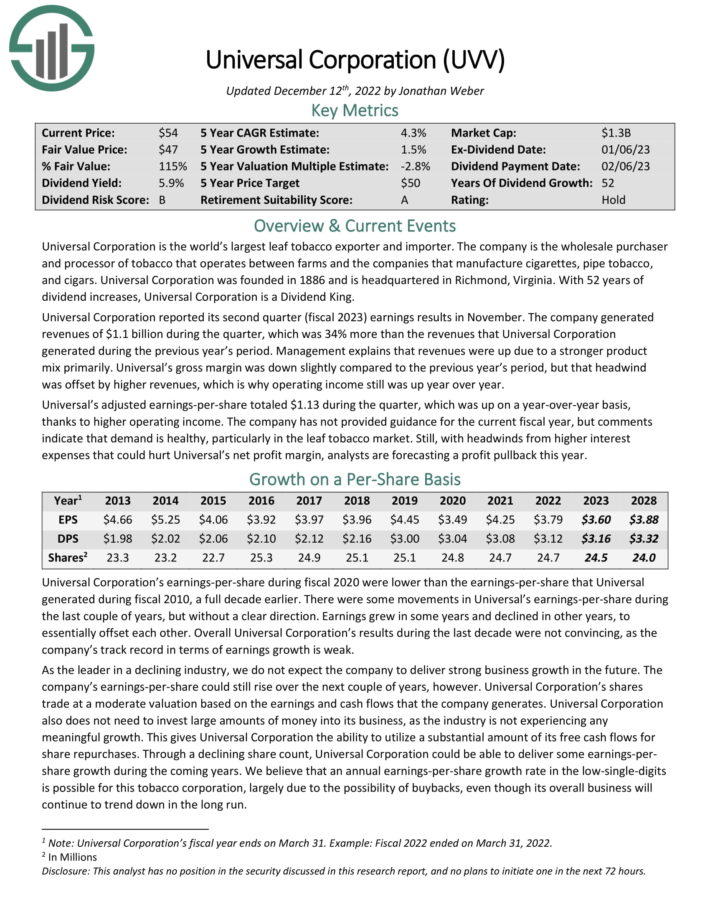
Blue-Chip Stock #16: Enterprise Products Partners LP (EPD)
- Dividend History: 25 years of consecutive increases
- Dividend Yield: 7.6%
- 5-year Annualized Standard Deviation: 31.62%
Enterprise Products Partners was founded in 1968 and operates as an oil and gas storage and transportation company.
Enterprise Products has an excellent asset base which consists of nearly 50,000 miles of natural gas, natural gas liquids, crude oil, and refined products pipelines. It also has a storage capacity of more than 250 million barrels.
These assets collect fees based on materials transported and stored.
Continued growth is likely over the next several years. The company has $5.8 billion of major capital projects under construction.
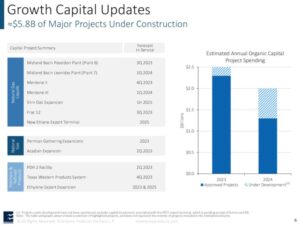
Source: Investor Presentation
Click here to download our most recent Sure Analysis report on Enterprise Products Partners (preview of page 1 of 3 shown below):
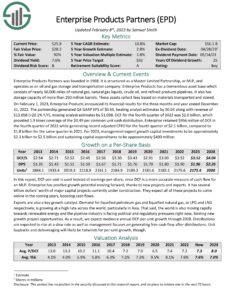
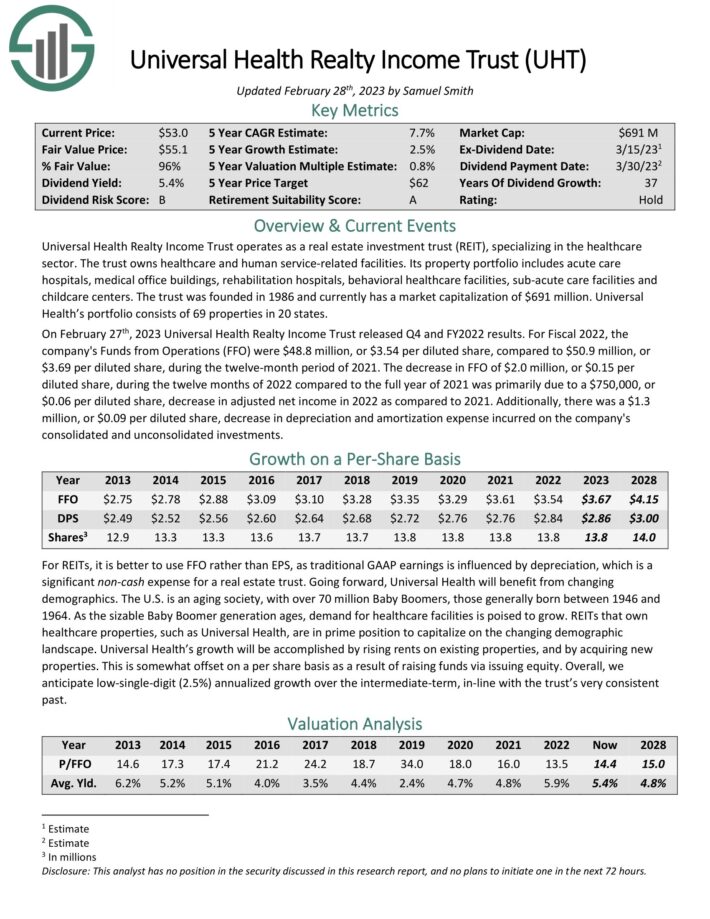
Blue-Chip Stock #17: Universal Health Realty Income Trust (UHT)
- Dividend History: 37 years of consecutive increases
- Dividend Yield: 6.0%
- 5-year Annualized Standard Deviation: 35.11%
Universal Health Realty Income Trust operates as a REIT, specializing in the healthcare sector. The trust owns healthcare and human service-related facilities. Its property portfolio includes acute care hospitals, medical office buildings, rehabilitation hospitals, behavioral healthcare facilities, sub-acute care facilities and childcare centers. The trust was founded in 1986 and currently has a market capitalization of $691 million. Universal Health’s portfolio consists of 69 properties in 20 states.
On February 27th, 2023 Universal Health Realty Income Trust released Q4 and FY2022 results. For Fiscal 2022, the company’s Funds from Operations (FFO) were $48.8 million, or $3.54 per diluted share, compared to $50.9 million, or $3.69 per diluted share, during the twelve-month period of 2021.
Going forward, Universal Health will benefit from changing demographics. The U.S. is an aging society, with over 70 million Baby Boomers, those generally born between 1946 and 1964. As the sizable Baby Boomer generation ages, demand for healthcare facilities is poised to grow.
REITs that own healthcare properties, such as Universal Health, are in prime position to capitalize on the changing demographic landscape. Universal Health’s growth will be accomplished by rising rents on existing properties, and by acquiring new properties.
Click here to download our most recent Sure Analysis report on UHT (preview of page 1 of 3 shown below):
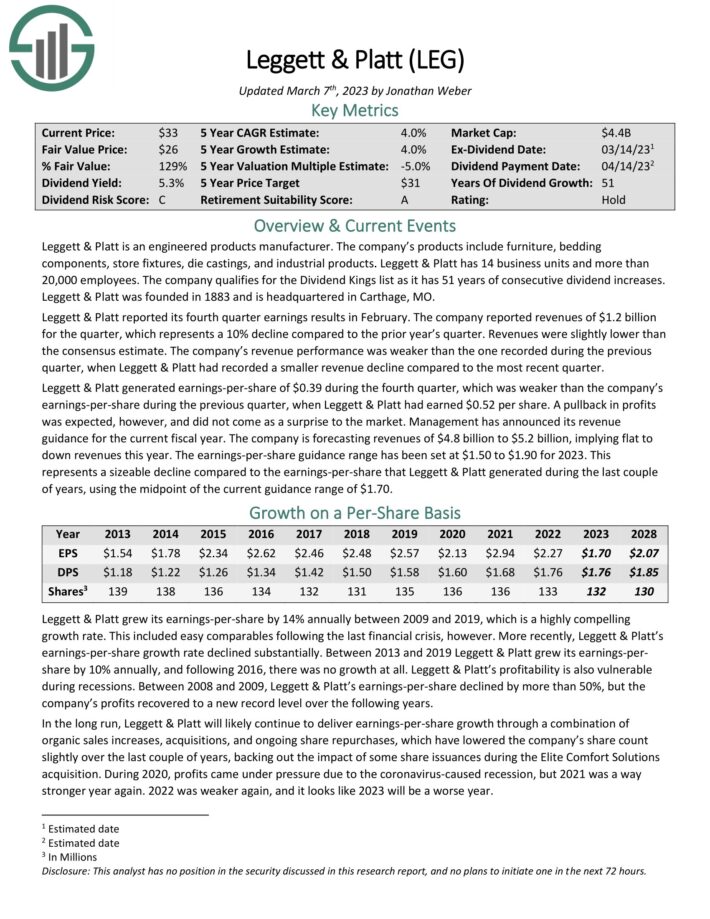
Blue-Chip Stock #18: Leggett & Platt (LEG)
- Dividend History: 51 years of consecutive increases
- Dividend Yield: 5.7%
- 5-year Annualized Standard Deviation: 35.41%
Leggett & Platt is an engineered products manufacturer. The company’s products include furniture, bedding components, store fixtures, die castings, and industrial products. Leggett & Platt has 14 business units and more than 20,000 employees.
Leggett & Platt reported its fourth quarter earnings results in February. The company reported revenues of $1.2 billion for the quarter, which represents a 10% decline compared to the prior year’s quarter. Revenues were slightly lower than the consensus estimate.
The company’s revenue performance was weaker than the one recorded during the previous quarter, when Leggett & Platt had recorded a smaller revenue decline compared to the most recent quarter.
Leggett & Platt generated earnings-per-share of $0.39 during the fourth quarter, which was weaker than the company’s earnings-per-share during the previous quarter, when Leggett & Platt had earned $0.52 per share. A pullback in profits was expected, however, and did not come as a surprise to the market.
Management has announced its revenue guidance for the current fiscal year. The company is forecasting revenues of $4.8 billion to $5.2 billion, implying flat to down revenues this year. The earnings-per-share guidance range has been set at $1.50 to $1.90 for 2023.
Click here to download our most recent Sure Analysis report on Leggett & Platt (preview of page 1 of 3 shown below):
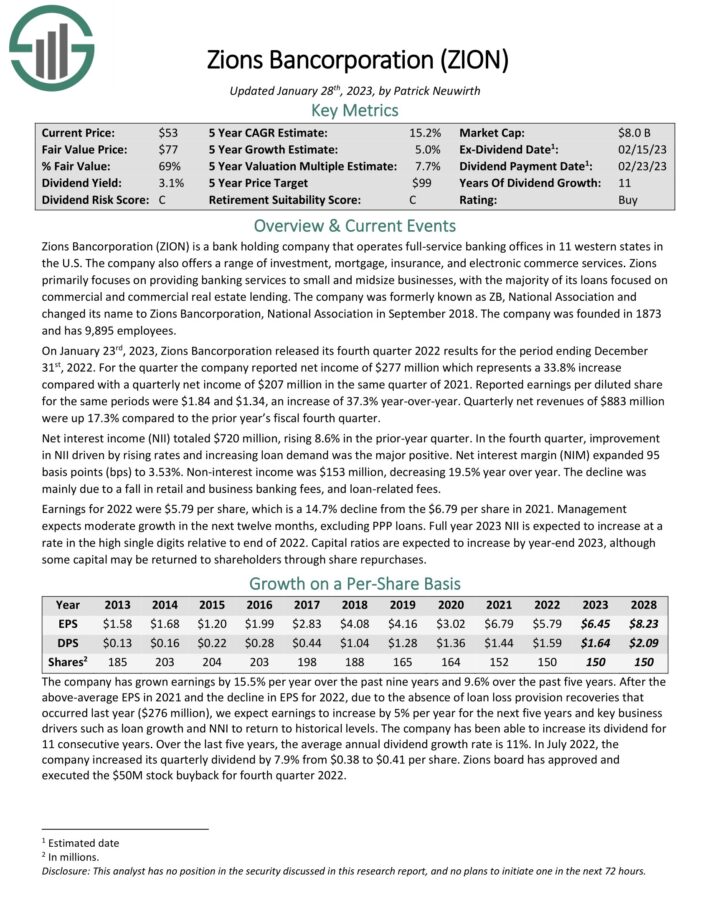
Blue-Chip Stock #19: Zions Bancorporation (ZION)
- Dividend History: 11 years of consecutive increases
- Dividend Yield: 5.4%
- 5-year Annualized Standard Deviation: 36.68%
Zions Bancorporation is a bank holding company that operates full-service banking offices in 11 western states in the U.S. The company also offers a range of investment, mortgage, insurance, and electronic commerce services. Zions primarily focuses on providing banking services to small and midsize businesses, with the majority of its loans focused on commercial and commercial real estate lending.

Source: Investor Presentation
On January 23rd, 2023, Zions Bancorporation released its fourth quarter 2022 results. For the quarter the company reported net income of $277 million which represents a 33.8% increase compared with a quarterly net income of $207 million in the same quarter of 2021. Reported earnings per diluted share for the same periods were $1.84 and $1.34, an increase of 37.3% year-over-year. Quarterly net revenues of $883 million were up 17.3% compared to the prior year’s fiscal fourth quarter.
Net interest income (NII) totaled $720 million, rising 8.6% in the prior-year quarter. In the fourth quarter, improvement in NII driven by rising rates and increasing loan demand was the major positive. Net interest margin (NIM) expanded 95 basis points (bps) to 3.53%. Non-interest income was $153 million, decreasing 19.5% year over year. The decline was mainly due to a fall in retail and business banking fees, and loan-related fees.
Earnings for 2022 were $5.79 per share, which is a 14.7% decline from the $6.79 per share in 2021. Management expects moderate growth in the next twelve months, excluding PPP loans. Full year 2023 NII is expected to increase at a rate in the high single digits relative to end of 2022. Capital ratios are expected to increase by year-end 2023, although some capital may be returned to shareholders through share repurchases.
Click here to download our most recent Sure Analysis report on ZION (preview of page 1 of 3 shown below):
Blue-Chip Stock #20: Fifth Third Bancorp (FITB)
- Dividend History: 12 years of consecutive increases
- Dividend Yield: 5.0%
- 5-year Annualized Standard Deviation: 37.25%
Fifth Third Bancorp owns and operates banks in 12 midwestern and southern U.S. states, including Georgia, Florida, Michigan and Ohio. The company has nearly 1,100 offices.
On January 19th, 2023, Fifth Third Bancorp reported fourth quarter and full year earnings results for the period ending December 31st, 2022. For the quarter, revenue grew 14.3% to $2.32 billion, which was $20 million less than expected. Earnings-per-share of $1.01 compared favorably to $0.91 in the prior year and was $0.01 above estimates.
For 2022, revenue grew 4.8% to $8.32 billion while earnings-per-share of $3.41 compared to $3.77 in the previous year. Average portfolio loans and leases improved 10.9% year-over-year to $121.4 billion. Provisions for credit losses was $180 million in the third quarter, compared to a benefit of $47 million in the prior year. The non-performing asset ratio of 0.44% was a 2 basis point improvement from the third quarter of the 2022 and a 3 basis points below the same period a year ago.
Average deposits declined 3.9% from the same period a year ago. Net interest income grew 5.3% sequentially and 32% year-over-year. Net-interest-margin of 3.35% was higher by 13 basis points quarter-over-quarter and was up 80 basis points year-over-year.
Click here to download our most recent Sure Analysis report on FITB (preview of page 1 of 3 shown below):

Additional Resources
The Blue Chips list is not the only way to quickly screen for stocks that regularly pay rising dividends.
Thanks for reading this article. Please send any feedback, corrections, or questions to [email protected].


