Published on April 13th, 2023 by Nikolaos Sismanis
While there may be varying interpretations among investors, the term “blue chip” typically denotes companies that are regarded as leaders in their respective fields.
To us, a stock is classified as a “blue chip” only if it has maintained a steady growth in dividends for at least ten years. This is a significant achievement as it indicates that the company has a robust business model that can weather tough economic conditions while still generating consistent profits.
Therefore, we s that investing in blue chip stocks could be a smart move for anyone looking for reliable dividend stocks that offer a high level of safety.
With all this in mind, we created a list of 350+ blue-chip stocks, which you can download by clicking below:’
In this article, we are looking at the best-performing blue chip stocks, which we’ve identified by looking at their price performance over the last 12 months. We are presenting them in ascending order for easy reference.
While past performance is not indicative of future returns, our curated list could highlight some promising investment opportunities. These stocks have gained significant momentum and possess a trusted “blue chip” classification, making them worth considering for potential investors.
Table of Contents
The list of the 10 Best Performing Blue Chip Stocks is below. Click on a company’s name to jump directly to the analysis of that company.
Best-Performing Blue Chip Tech Stock #10: Lancaster Colony Corporation (LANC)
- Last-12-Month Return: 32.7%
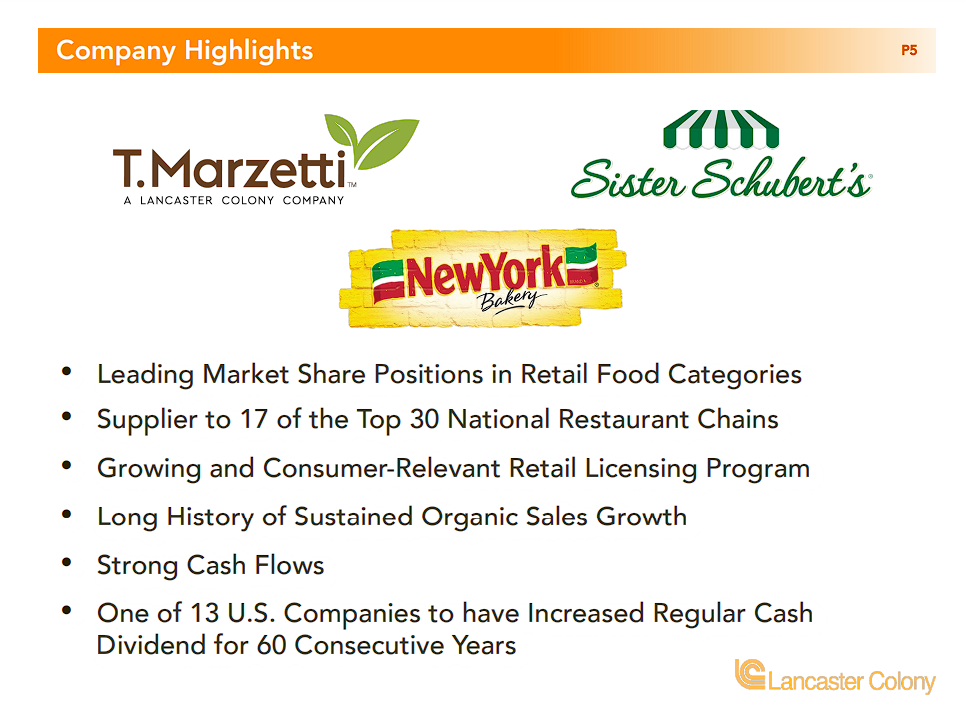
After shifting away from housewares, Lancaster Colony has been making food products since 1969. The move has afforded the company some meaningful growth in the past five decades, and the stock has a $5.1 billion market capitalization on $1.8 billion in annual revenue. Lancaster Colony makes various meal accessories like croutons and bread products in frozen and non-frozen categories. Lancaster also has one of the best dividend increase streaks in the entire market, boasting 60 consecutive years of dividend increases.
Source: Investor Presentation
Lancaster reported second-quarter earnings on February 2nd, 2023, and the results were somewhat mixed. Earnings-per-share came to $1.45, which was 11 cents below estimates. Revenue was up 11% year-over-year to $477 million, which was $2.4 million better than expectations.
Retail net sales grew 5.6% to $259 million, while Foodservice net sales were 19.2% higher at $219 million. Retail sales saw favorable inflationary pricing impacts, as sales volume declined 3.8%. The company believes pricing actions led to lower volumes. In Foodservice, sales volume fell 4.6% as the company exited certain businesses during fiscal 2022.
The company did see increased demand from quick-service customers, and inflationary pricing helped boost the top line significantly. Gross profit was up $5.5 million to $102 million as pricing actions offset inflationary costs in commodities, packaging, labor, freight, and warehousing. Consolidated operating income was up $6 million, or 13.3%, year-over-year. Earnings-per-share rose from $1.25 to $1.45 year-over-year, and we see $6.05 for 2023.
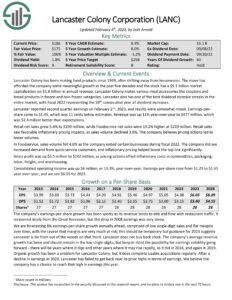
Click here to download our most recent Sure Analysis report on Lancaster Colony Corporation (LANC) (preview of page 1 of 3 shown below):
Best-Performing Blue Chip Tech Stock #9: Merck & Co., Inc. (MRK)
- Last-12-Month Return: 33.8%
Merck & Company is one of the largest healthcare companies in the world. Merck manufactures prescription medicines, vaccines, biological therapies, and animal health products. Merck employs 67,000 people around the world and generates annual revenues of ~$59 billion.
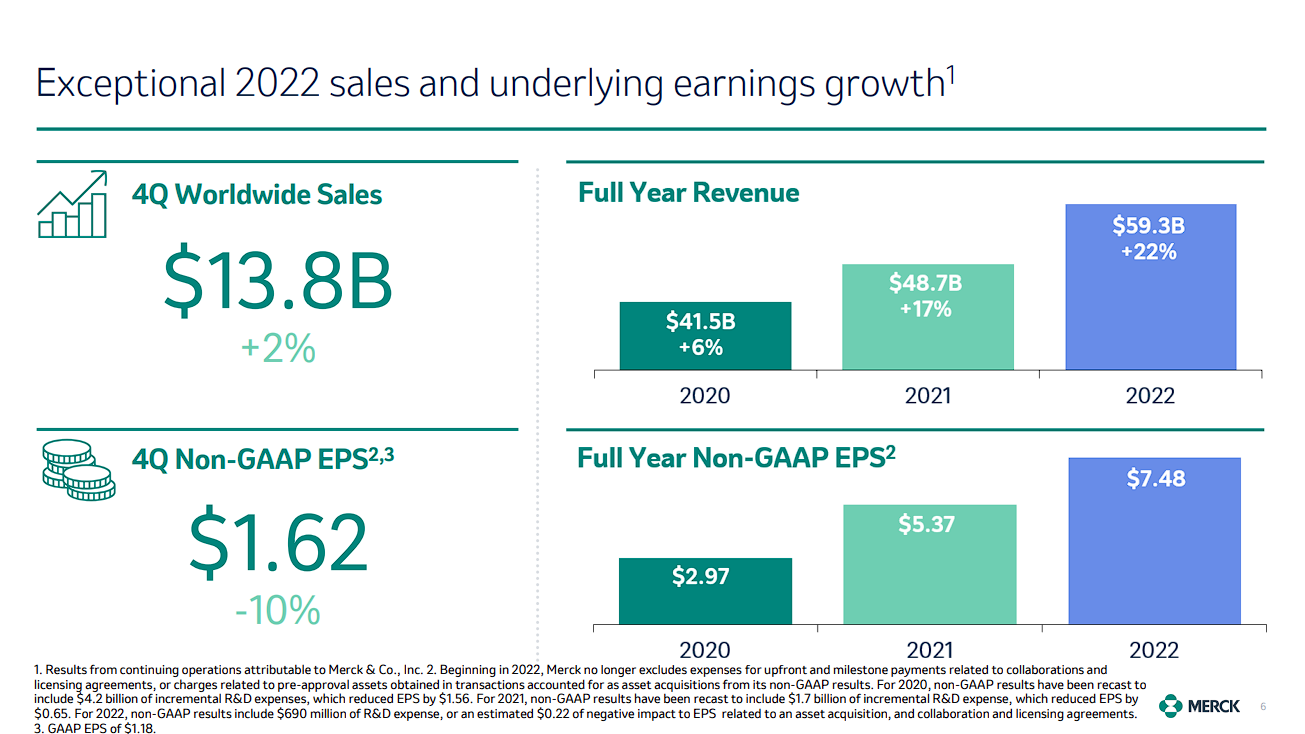
On February 2nd, 2023, Merck reported the fourth quarter and full-year results for the period ending December 31st, 2022. For the quarter, revenue grew 2.1% to $13.8 billion, beating estimates by $140 million. In the prior year, an adjusted net income of $4.1 billion, or $1.62 per share, compared to an adjusted net income of $4.6 billion, or $1.81 per share, but was $0.08 more than expected.
Source: Investor Presentation
For the year, revenue grew 22% to $59.3 billion. Adjusted earnings-per-share totaled $7.48, above the high end of the company’s guidance. Currency exchange reduced revenue results by 6% for the quarter and 4% for the year. On a reported basis, pharmaceutical revenue increased by 1% to just over $12 billion for the quarter.
Merck provided guidance for 2023 as well. The company expects sales in a range of $57.2 billion to $58.7 billion, with adjusted earnings-per-share projected to be between $6.80 to $6.95. At the midpoint, this would be a decline of 8% from 2022.
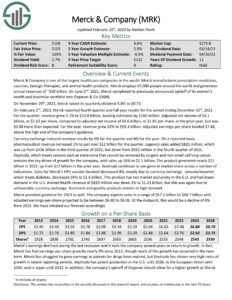
Click here to download our most recent Sure Analysis report on Merck & Co., Inc. (MRK) (preview of page 1 of 3 shown below):
Best-Performing Blue Chip Tech Stock #8: RenaissanceRe Holdings Ltd. (RNR)
- Last-12-Month Return: 33.9%
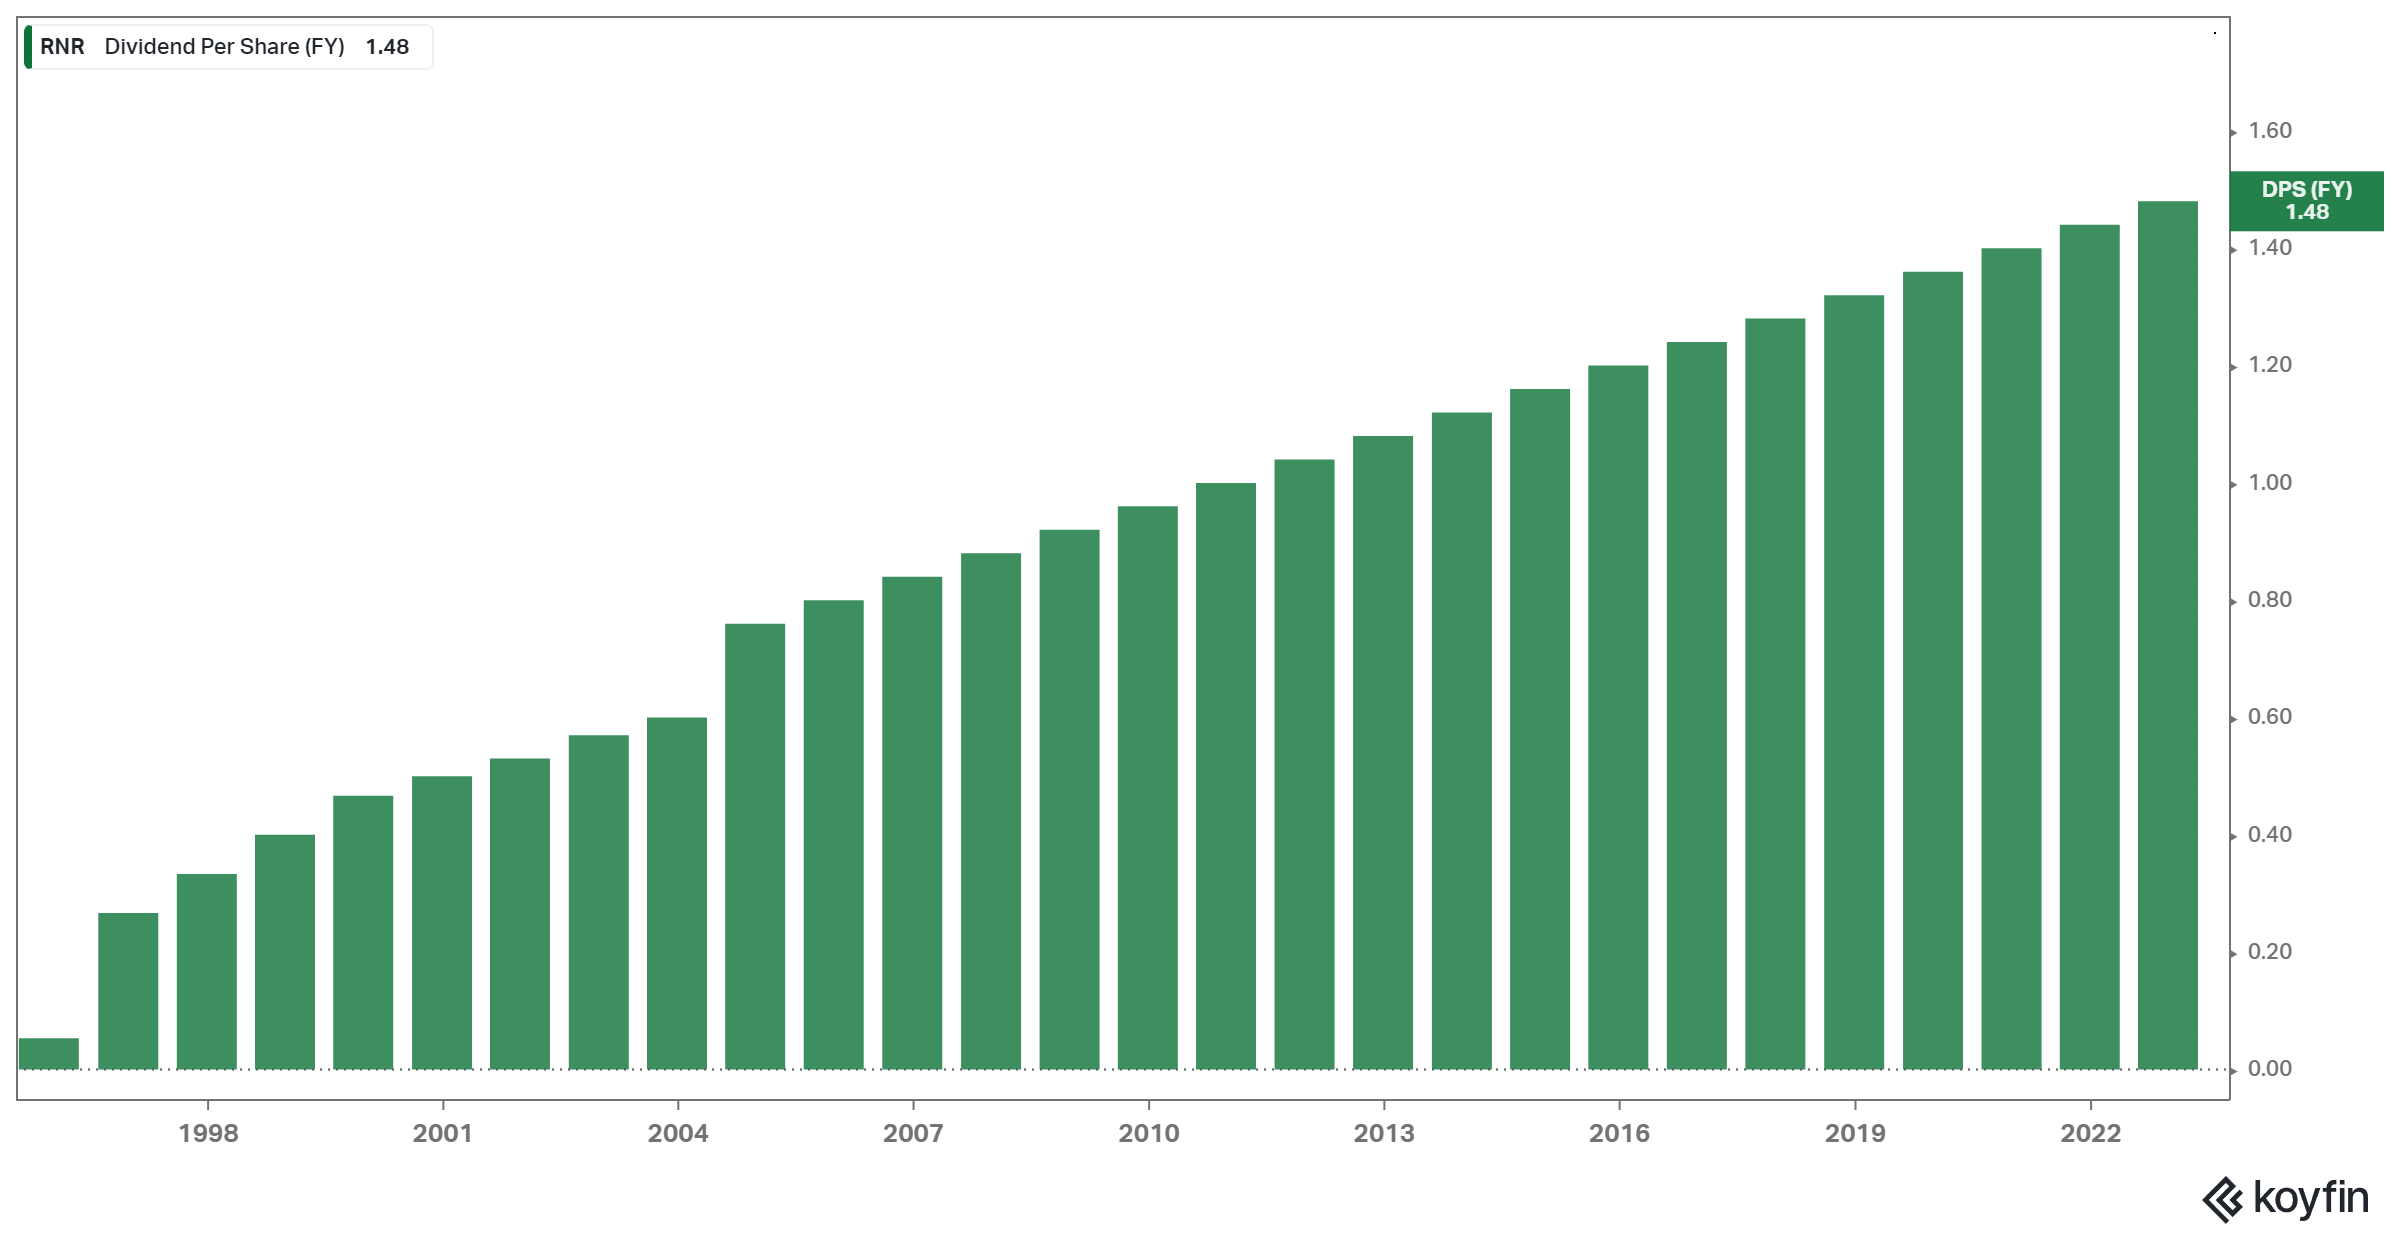
Established in 1993 and headquartered in Bermuda, RenaissanceRe Holdings Ltd. is a global provider of reinsurance and insurance. The company provides property, casualty, specialty reinsurance through RenaissanceRe and joint ventures, including DaVinci, Top Layer Re, Starbound, Glencoe Group, and Starbound II. Approximately half of its premiums earned are attributable to property policies, with the remainder allocated to casualty and specialty. The $8.81 billion market cap company has increased its dividend for 27 consecutive years.
Source: Koyfin
On January 31st, 2023, RenaissanceRe reported its Q4-2022 and full-year results for the period ending December 31st, 2022. For the quarter, total revenues equaled $2.0 billion, 43.8% higher compared to Q4-2021. Note that the increase is rather misleading, as it includes RenaissanceRe’s bond portfolio being marked-to-market upwards due to the modest reduction in interest rates on medium-term U.S. treasuries and the narrowing of credit spreads on the corporate and high-yield fixed maturity portfolios. Higher investment income due to increased yields in fixed-maturity trading also boosted results.
For the quarter, the company also reported a net income of $448.0 million or $10.30 per share compared to a net income of $210.9 million or $4.65 per share in last year’s comparable period as a result of such adjustments in investments.
RenaissanceRe ended the year with a book value of $104.65 and a tangible book value of $98.81. With accumulated dividends, TBV/share reached $123.81. For FY-2023, we are assuming underlying earnings power of $16.00 per share.
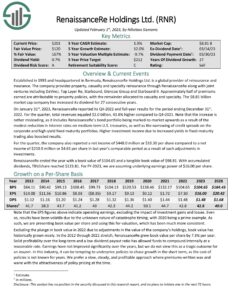
Click here to download our most recent Sure Analysis report on RenaissanceRe Holdings Ltd. (RNR) (preview of page 1 of 3 shown below):
Best-Performing Blue Chip Tech Stock #7: Cardinal Health, Inc. (CAH)
- Last-12-Month Return: 34.2%
Dublin, Ohio-based Cardinal Health is one of the “Big 3” drug distribution companies along with McKesson (MKC) and AmerisourceBergen (ABC). Cardinal Health serves over 24,000 United States pharmacies and more than 85% of the country’s hospitals. The company has operations in more than 30 countries with approximately 46,000 employees. With 35 years of dividend increases, the $20.5 billion market cap company is a member of the Dividend Aristocrats Index.
On May 5th, Cardinal Health announced that its prior agreement to pay $6 billion over 18 years in a national opioid settlement was finalized. More than 98% of lawsuits are included in this settlement.
On May 10th, 2022, Cardinal Health increased its quarterly dividend by 1% to $0.4957. On February 2nd, 2023, Cardinal Health released results for the second quarter of the fiscal year 2023 for the period ending December 31st, 2022.
The company’s revenue grew 13.2% for the quarter to $51.47 billion, which was $1.44 billion more than expected. On an adjusted basis, the company’s posted earnings of $467 million were flat year-over-year. Still, adjusted earnings-per-share of $1.32 was up slightly from $1.27 in the prior year because of a lower share count and interest expense. Adjusted earnings-per-share was $0.23 above estimates.
For the quarter, Pharmaceutical sales of $47.7 billion was a 15% increase year-over-year, while segment profit of $431 million was up 9%. Branded pharmaceutical and specialty pharmaceuticals benefited from new customers. Revenue for the Medical segment decreased by 7% to $3.8 billion, while segment profit was down 66%. Inflationary pressures and lower volumes in products and distribution were the primary reasons for the declines. The Pharmaceutical segment makes up the lion’s share of revenues, but the Medical segment remains important due to its higher margins and growth potential.

Source: Investor Presentation
Cardinal Health also provided updated guidance for the fiscal year 2023, with the company expecting adjusted earnings-per-share of $5.20 to $5.50, up from $5.05 to $5.40. At the midpoint, this would be a 5.9% improvement from the prior year.
Click here to download our most recent Sure Analysis report on Cardinal Health, Inc. (CAH) (preview of page 1 of 3 shown below):

Best-Performing Blue Chip Tech Stock #6: Starbucks Corporation (SBUX)
- Last-12-Month Return: 34.9%
Starbucks began with a single store in Seattle’s Pike Place Market in 1971 and now has more than 36,000 stores worldwide. About half of the stores are in the U.S., and nearly 20% of the stores are in China. The company operates under the namesake Starbucks brand but also holds the Teavana, Evolution Fresh, and Ethos Water brands in its portfolio. The $120 billion market cap company generated $32 billion in annual revenue in fiscal 2022.
In early February, Starbucks reported (2/2/23) financial results for the first quarter of the fiscal year 2023 (Starbucks’ fiscal year ends the Sunday closest to September 30th). The company grew its comparable store sales by 5% thanks to 10% growth in the U.S., which more than offset a -13% decrease in international markets, including a -29% decrease in China. Same-store sales in China remained depressed for the fourth quarter in a row due to lockdowns. Nevertheless, adjusted earnings-per-share edged up from $0.69 in the prior year’s quarter to $0.74.

Source: Q1 Infographic
We expect the headwinds from the lockdowns in China and high inflation to somewhat subside later this year. Starbucks reiterated its positive guidance for 2023, expecting earnings-per-share growth at the low end of its long-term guidance of 15%-20% growth. Howard Schultz, the legendary CEO of Starbucks, has returned to the helm for the third time in his career. Starbucks thrived in the previous two tenures of Schultz.
As soon as he returned to the CEO position, he suspended share repurchases and stated that the company should focus on its growth initiatives. Unfortunately, he recently stated that he would step down and never serve as a CEO again. This could be a negative development for the company.
Click here to download our most recent Sure Analysis report on Starbucks Corporation (SBUX) (preview of page 1 of 3 shown below):

Best-Performing Blue Chip Tech Stock #5: Applied Industrial Technologies, Inc. (AIT)
- Last-12-Month Return: 36.3%
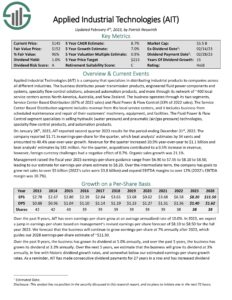
Applied Industrial Technologies (AIT) is a company that specializes in distributing industrial products to companies across all different industries. The business distributes power transmission products, engineered fluid power components and systems, specialty flow control solutions, advanced automation products, and more through its network of ~400 local service centers across North America, Australia, and New Zealand.
The business operates through its two segments, Service Center Based Distribution (67% of 2022 sales) and Fluid Power & Flow Control (33% of 2022 sales). The Service Center Based Distribution segment includes revenue from the local service centers and businesses from scheduled maintenance and repair of their customers’ machinery, equipment, and facilities. The Fluid Power & Flow Control segment specializes in selling hydraulic (water pressure) and pneumatic (air/gas pressure) technologies, specialty flow control products, and automation products.
On January 26th, 2023, AIT reported second quarter 2023 results for the period ending December 31st, 2022. The company reported $1.71 in earnings-per-share for the quarter, which beat analysts’ estimates by 34 cents and amounted to 40.4% year-over-year growth. Revenue for the quarter increased 20.9% year-over-year to $1.1 billion and beat analysts’ estimates by $81 million.
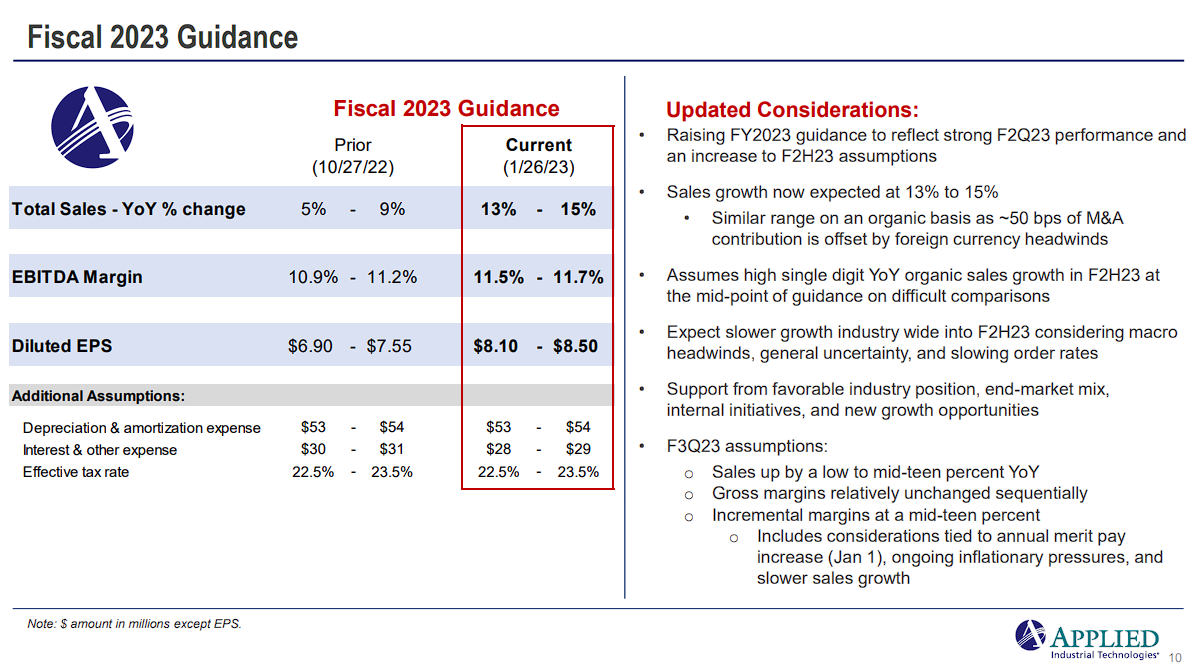
For the quarter, acquisitions contributed to a 0.5% increase in revenue. However, foreign currency challenges had a negative effect of 0.7%. Organic sales growth was 21.1%. Management raised the fiscal year 2023 earnings-per-share guidance range from $6.90 to $7.55 to $8.10 to $8.50.
Source: Investor Presentation
Over the intermediate term, the company has goals to grow net sales to over $5 billion (2022’s sales were $3.8 billion) and expand EBITDA margins to over 12% (2022’s EBITDA margin was 10.7%).
Click here to download our most recent Sure Analysis report on Applied Industrial Technologies, Inc. (AIT) (preview of page 1 of 3 shown below):
Best-Performing Blue Chip Tech Stock #4: Reliance Steel & Aluminum Co. (RS)
- Last-12-Month Return: 38.6%
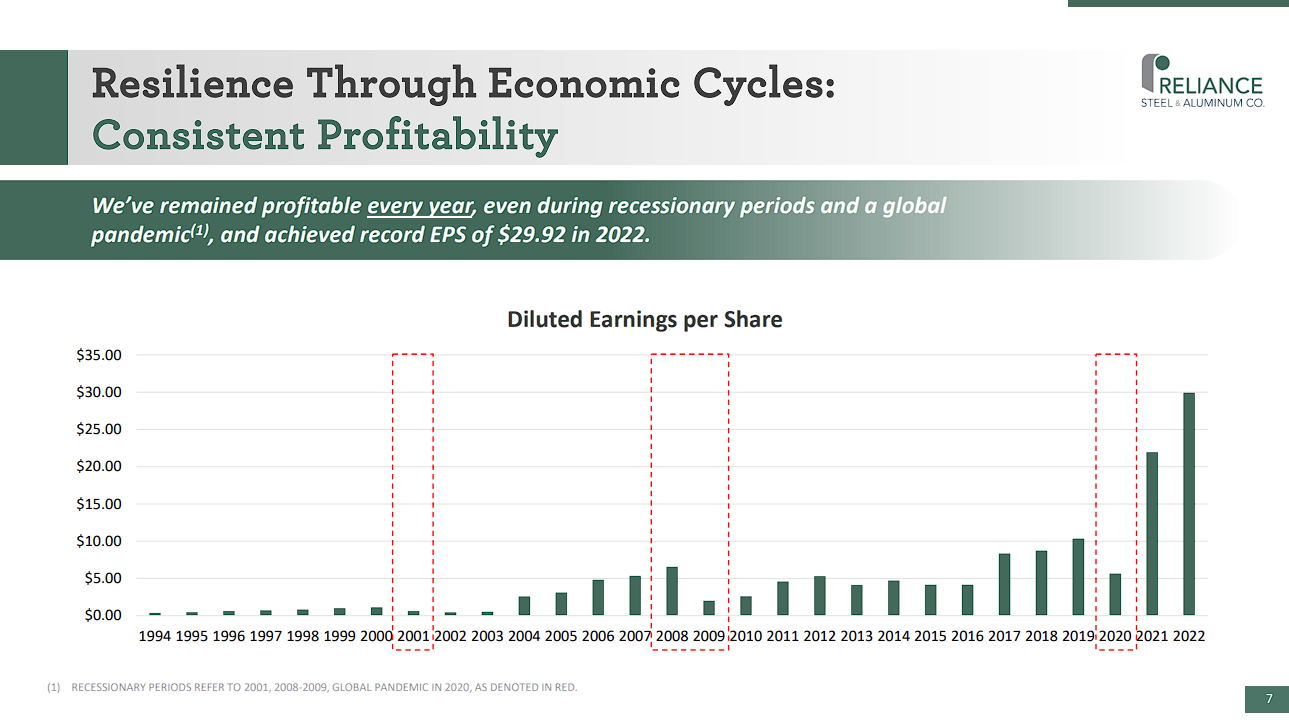
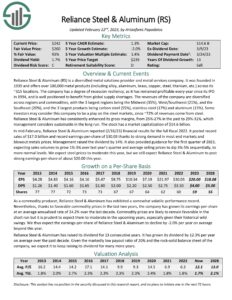
Reliance Steel & Aluminum (RS) is a diversified metal solutions provider and metal services company. It was founded in 1939 and offered over 100,000 metal products (including alloy, aluminum, brass, copper, steel, titanium, etc.) across its ~315 locations. The company has a degree of recession resiliency, as it has remained profitable every year since its IPO in 1994 and is well-positioned to benefit from global supply shortages. The company now has a market capitalization of $14.3 billion.
Source: Investor Presentation
The revenues of the company are diversified across regions and commodities, with the three largest regions being the Midwest (35%), West/Southwest (21%), and the Southeast (20%), and the three largest products being carbon steel (55%), stainless steel (17%) and aluminum (15%). Some investors may consider this company to be a play on the steel markets since ~72% of revenues come from steel. Reliance Steel & Aluminum has consistently enhanced its gross margins, from 25%-27% in the past to 29%-31%, which management considers sustainable in the long run.
In mid-February, Reliance Steel & Aluminum reported (2/16/23) financial results for the full fiscal 2022. It posted record sales of $17.0 billion and record earnings-per-share of $30.03 thanks to strong demand in most end markets and blowout metals prices.
Management raised the dividend by 14%. It also provided guidance for the first quarter of 2023, expecting sales volumes to grow 1%-3% over last year’s quarter and average selling prices to dip 3%-5% sequentially to more normal levels. We expect steel prices to moderate this year, but we still expect Reliance Steel & Aluminum to post strong earnings-per-share of about $20.00 this year.
Click here to download our most recent Sure Analysis report on Reliance Steel & Aluminum Co. (RS) (preview of page 1 of 3 shown below):
Best-Performing Blue Chip Tech Stock #3: Valero Energy Corporation (VLO)
- Last-12-Month Return: 39.8%
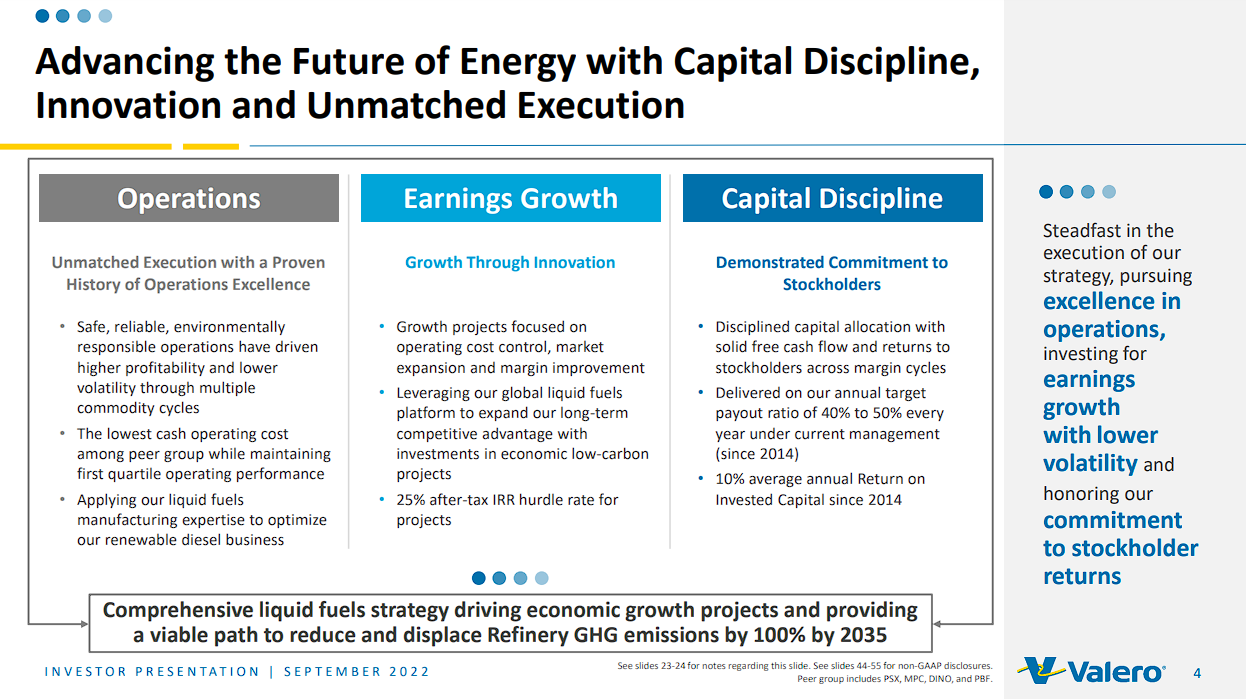
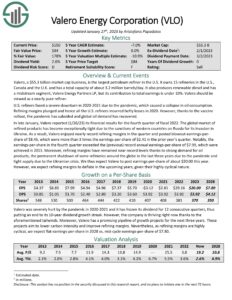
Valero, a $55.3 billion market cap business, is the largest petroleum refiner in the U.S. It owns 15 refineries in the U.S., Canada, and the U.K. and has a total capacity of about 3.2 million barrels/day. It also produces renewable diesel and has a midstream segment, Valero Energy Partners LP, but its contribution to total earnings is under 10%.
Source: Investor Presentation
Valero should be viewed as a nearly pure refiner. U.S. refiners faced a severe downturn in 2020-2021 due to the pandemic, which caused a collapse in oil consumption. Refining margins plunged, and hence all the U.S. refiners incurred hefty losses in 2020. However, following the pandemic easing, global oil demand recovered swiftly.
In late January, Valero reported (1/26/23) its financial results for the fourth quarter of fiscal 2022. The global market of refined products has become exceptionally tight due to Western countries’ sanctions on Russia for its invasion of Ukraine. As a result, Valero enjoyed nearly record refining margins in the quarter and posted blowout earnings-per-share of $8.45, which were more than three times the earnings-per-share of $2.41 in the prior year’s quarter.
Notably, the earnings-per-share in the fourth quarter exceeded the (previous) record annual earnings-per-share of $7.99, which was achieved in 2015. Moreover, refining margins have remained near record levels thanks to strong demand for oil products, the permanent shutdown of some refineries around the globe in the last three years due to the pandemic, and tight supply due to the Ukrainian crisis. We thus expect Valero to post earnings-per-share of about $20.00 this year. However, given their highly cyclical nature, we expect refining margins to deflate in the upcoming years.
Click here to download our most recent Sure Analysis report on Valero Energy Corporation (VLO) (preview of page 1 of 3 shown below):
Best-Performing Blue Chip Tech Stock #2: Ryder System, Inc. (R)
- Last-12-Month Return: 41.0%
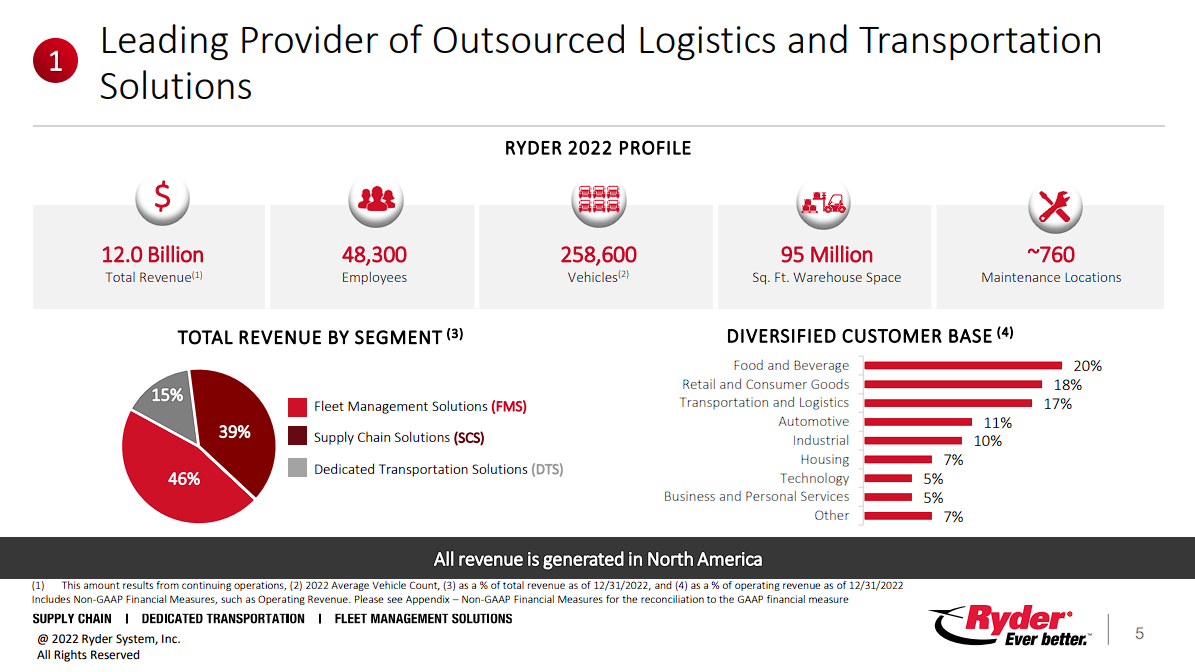
In 1933, Jim Ryder made a $35 down payment on one truck. Today that has transformed into a $4.6 billion commercial transportation, logistics, and supply chain management solutions company with 250,000+ vehicles and 55 million square feet of warehouse space.
The business is divided into three segments – Fleet Management (FMS), Dedicated Transportation (DTS), and Supply Chain Solutions (SCS) – providing commercial truck rental, truck leasing, used trucks for sale, and last-mile delivery services. Ryder generated $12.0 billion in revenue last year.
Source: Investor Presentation
In mid-February, Ryder reported (2/15/23) financial results for the fourth quarter of fiscal 2022. Thanks to growth in all business segments, it grew its operating revenue by 14% over the prior year’s quarter. Adjusted earnings-per-share grew 11%, from $3.52 to $3.89, and exceeded the analysts’ consensus by $0.40, primarily thanks to strong performance in Supply Chain Solutions and Dedicated Transportation, which more than offset high-cost inflation and lower sales of used vehicles.
However, due to business deceleration in used vehicle sales and rental, Ryder provided guidance for earnings-per-share of $11.05-$12.05 in 2023. Given the tendency of management to issue cautious guidance and given that Ryder has exceeded the analysts’ consensus by a wide margin for eight quarters in a row, we expect earnings-per-share of $11.70 this year, above the mid-point of the guidance of management.
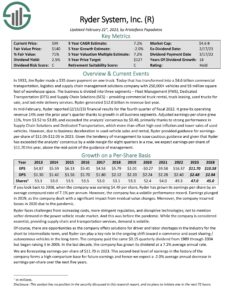
Click here to download our most recent Sure Analysis report on Ryder System, Inc. (R) (preview of page 1 of 3 shown below):
Best-Performing Blue Chip Tech Stock #1: Exxon Mobil Corporation (XOM)
- Last-12-Month Return: 42.5%
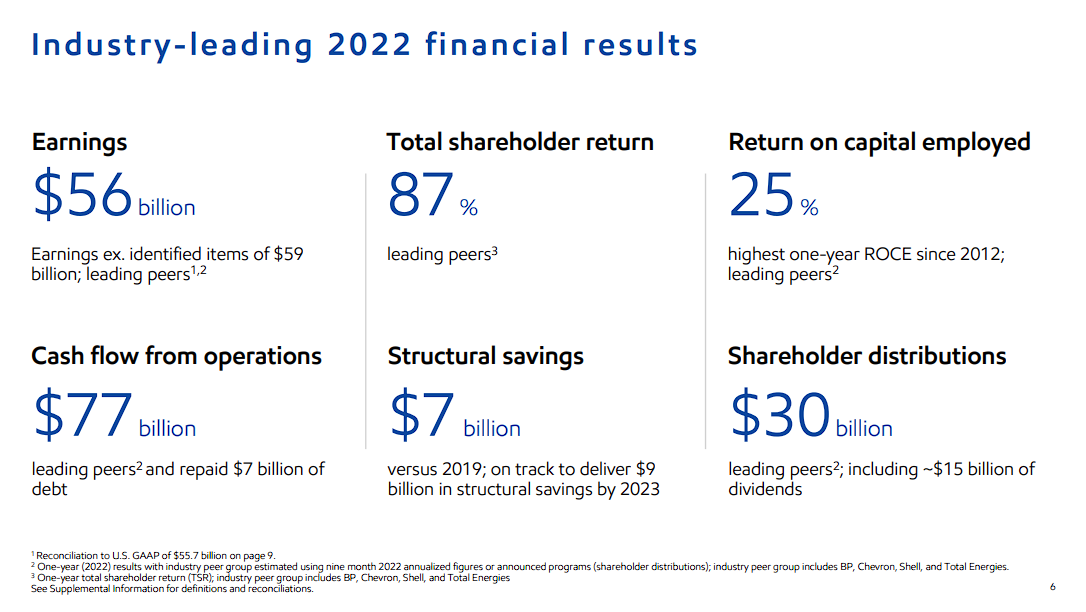
Exxon Mobil is a diversified energy behemoth with a market capitalization of $468.4 billion. In 2022, the upstream segment generated 67% of the total earnings of Exxon while the downstream and chemical segments generated 27% and 6% of the total earnings, respectively.
In late January, Exxon reported (1/31/23) financial results for the fourth quarter of fiscal 2022. Its production in the Permian reached an all-time high, and its total production rose by 3%. However, oil and gas prices moderated off their blowout levels in previous quarters. As a result, Exxon saw its earnings-per-share dip -24% sequentially, from $4.45 to $3.40.
In the full year, Exxon posted record earnings-per-share of $14.06. Thanks to the sustained tailwind from Western countries’ sanctions on Russia, we expect strong earnings-per-share of about $10.50 in 2023. In contrast to previous rallies of oil and gas prices, producers have boosted their output conservatively, fearing that the rally will prove short-lived due to the secular shift of most countries from fossil fuels to clean energy sources.
Source: Investor Presentation
As long as producers remain cautious, the oil price will likely remain high. Oil prices will likely remain above average in the short run, but we do not expect them to remain so high for years. We believe that oil and gas prices have already peaked. Moreover, Exxon raised its dividend by 3% in the fourth quarter, and thus it extended its dividend growth streak to 40 years.
Exxon also has a $30 billion share repurchase program for 2022-2023. This amount can reduce the share count by 7% at current stock prices. However, as the stock price is at an all-time high and is infamous for its cyclicality, we do not applaud this program. Exxon has made the same mistake in the past.
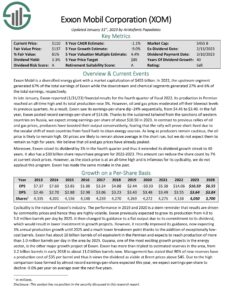
Click here to download our most recent Sure Analysis report on Exxon Mobil Corporation (XOM) (preview of page 1 of 3 shown below):
Final Thoughts
Investors seeking lucrative investment options will likely find numerous options amongst blue chip stocks. These companies possess a remarkable track record of financial stability and a dominant market position, in addition to other appealing attributes, which make them particularly attractive.
The blue-chip stocks featured in this article have exhibited remarkable performance in the last 12 months, with a powerful momentum indicating that they may still have fuel in their tanks. However, caution should be exercised as some of these stocks may have sprinted too far ahead of themselves, leaving them vulnerable to a correction. Therefore, conducting a thorough analysis of each stock is prudent before considering any investment decisions.
If you are interested in finding more high-quality dividend growth stocks suitable for long-term investment, the following Sure Dividend databases will be useful:
The major domestic stock market indices are another solid resource for finding investment ideas. Sure Dividend compiles the following stock market databases and updates them monthly:
Thanks for reading this article. Please send any feedback, corrections, or questions to [email protected].


